PIVOT POINT INDICATORS, DAILY
PIVOT POINT INDICATORS, WEEKLY PIVOT POINT INDICATORS, BI-WEEKLY PIVOT
POINT INDICATORS, MONTHLY PIVOT
POINT INDICATORS, QUARTERLY PIVOT POINT INDICATORS, BI-QUARTERLY PIVOT
POINT INDICATORS, ANNUAL PIVOT POINT INDICATORS, CONGRESSIONAL CYCLE
PIVOT POINT INDICATORS, PRESIDENTIAL CYCLE PIVOT POINT INDICATORS.
DAILY
PIVOT POINT INDICATOR, 2 DAY PIVOT POINT INDICATOR, 3 DAY PIVOT POINT
INDICATOR, WEEKLY PIVOT POINT INDICATOR. TIME CYCLE PIVOT POINTS.
PIVOT
POINT INDICATORS - KEY ACTIVE PIVOT POINT INDICATORS - FOCUS INTEREST
OPPORTUNITY PERIOD (FIOP) SCENARIO SETUP OPPORTUNITY PIVOT POINT
INDICATORS (SSOI-PPI) - TODAY'S TOMORROW TRADER'S EDGE (TTTE) FOCUS
FORECAST PROJECTION PIVOT POINT INDICATOR FRAMECHARTS AND GUIDEMAP GRIDS
- KEY ACTIVE TIME CYCLE PIVOT POINT PRICE PROJECTION INDICATOR
(EV-PPPP) HIGHLIGHTS AND ILLUSTRATIONS - ADVANCED MARKET INTELLIGENCE
PIVOT POINT INDICATORS FOR ACTIVE ADVANCED POSITION AND RISK MANAGEMENT -
SUPPORTING ACTIVE ADVANCED POSITION AND RISK MANAGEMENT HIGH ALPHA
EXTENSION OTAPS ACTION SIGNAL PRECISION PIVOT POINT APPLICATIONS (OTAPS)
- FOR HIGH ALPHA EXTENSION ACTIVE ADVANCED PIVOT POINT APPLICATION
MANAGEMENT OPPORTUNITY
INSIDE
THE KEY ACTIVE Presidential, Congressional, Annual,
BiQuarterly, Quarterly, BiMonthly, Monthly,
BiWeekly, Weekly, 48Hour, 24Hour, and Global
Rotation Cycle ECHOVECTOR
PGRAMS, ALSO UTILIZING KEY ACTIVE INTRADAY GREV TPP SRP FRAMING
PERSPECTIVES
TTTE FRAMCHART INTRADAY CANDLE PERSPECTIVES.
INSIDE
THE KEY ANNUAL, QUARTERLY, MONTHLY, WEEKLY, AND DAILY PIVOT POINT
PRICE PROJECTION PGRAM SUPPORT-AND-RESISTANCE CHANNEL PIVOT POINT PRICE
PROJECTION INDICATORS, AND THEIR RELATIVE STRENGTH CYCLICAL INTERSECTS:
HIGHLIGHTED AND ILLUSTRATED.
PIVOT
POINT PRICE PROJECTIONS AND GENERAL FORECAST PROJECTION MARKET
INTELLIGENCE PROVIDED BY THE MDPP PRECISION PIVOTS GLOBAL FINANCIAL
MARKETS LABORATORY, ADVANCEVEST.COM, PRECISION PIVOTS CAPITAL, MARKETPIVOTS.NET, AND THE ECHOVECTOR TECHNICAL ANALYSIS ASSOCIATION MEMBERSHIP.
TO
ENLARGE AND FURTHER ZOOM 'TODAY'S TOMORROW TRADER'S EDGE' PIVOT POINT
PRICE PROJECTION FOCUS FORECAST PROJECTION INDICATOR FRAMECHART
SNAPSHOT IMAGES:
1.
RIGHT CLICK ON ANY PROVIDED FRAMECHART SNAPSHOT IMAGE TO PRODUCE A DROP-DOWN
MENU. AT THE TOP OF THE APPEARING DROP-DOWN MENU FIND 'OPEN IMAGE IN NEW TAB'. PROCEED TO LEFT
CLICK ON 'OPEN IMAGE IN NEW TAB'.
THEN GO TO THE NEW TAB LISTED ALONG THE TOP OF YOUR OPEN WINDOW, AND
LEFT CLICK ON IT'S WORDAGE TO OPEN THE FRAMECHART SNAPSHOT IMAGE NOW
PROVIDED ENLARGED.
2.
ON THE ENLARGED FRAMCHART SNAPSHOT MAGE OPENED IN THE NEW TAB, YOU CAN ADDITIONALLY RIGHT CLICK THE PLUS
MAGNIFIER TO FURTHER ENLARGE AND ZOOM THE FRAMECHART SNAPSHOT IMAGE FOR EVEN CLOSER INSPECTION, STUDY, AND REVIEW!
*THIS
POST MAY INCLUDE POST MASTERS AND POST DOCTORAL LEVEL EDUCATIONAL AND
DISSERTATIVE INFORMATION AND MARKET INTELLIGENCE REFERENCINGS, AND FURTHER PROFESSORIAL TUTORIAL CONTEXTINGS AND
REFERENCINGS, WITHIN THE TECHNICAL FIELDS OF MARKET BEHAVIORAL ECONOMICS,
FINANCIAL MARKET PIVOTS TECHNICAL ANALYSIS, AND ADVANCED FINANCIAL
PHYSICS, DISSEMITATIVELY.
PIVOT POINT INDICATORS - INSIDE THE ANNUAL CYCLE PIVOT POINT PRICE PROJECTION PGRAM INDICATOR
https://tos.mx/yp7GFvj (MSFT - Mega- Proxy NDX, DJX, SPX Peb Indicator) 1hc

PIVOT POINT INDICATORS - INSIDE THE BIQUARTERLY CYCLE PIVOT POINT PRICE PROJECTION PGRAM INDICATOR
https://tos.mx/KTnFLRQ 1hc

PIVOT POINT INDICATORS - INSIDE THE QUARTERLY CYCLE PIVOT POINT PRICE PROJECTION PGRAM INDICATOR
https://tos.mx/QGn4J3L 30mc
WITHIN THE KEY ACTIVE QEV SRP 11AM ET USA 30MC HIGH PGRAM, WITH QEV HIGHLIGHTED IN LIGHT BRIGHT GREEN, THE UPWARD SLOPING TRAJECTORY - BEING SUPPORT BY LSE CLOSING HOUR PRICE ACTION - AND NOTICE THE CONGRUENT AND PARALLEL DOTTED LIGHT BRIGHT GREEN CFEV RADIATING FROM QEV EBP EBD TPP 11AM ETUSA 30MC HIGH NPP , AND HOW IT INDICATES CONGRUENCY WITH CFW POTENTIAL PRE-OPTIONS EXPERITION PEB TARGET HAVING POSSIBLY ALREADY BEEN MET.

PIVOT POINT INDICATORS - INSIDE THE MONTHLY, BIWEEKLY, WEEKLY, AND 24HOUR CYCLE PIVOT POINT PRICE PROJECTION PGRAM INDICATORS
https://tos.mx/RCkRVjw 15MC SRP 1145AM ET USA

PIVOT POINT INDICATORS - INSIDE THE BIWEEKLY, WEEKLY, AND 24HOUR CYCLE PIVOT POINT PRICE PROJECTION PGRAM INDICATORS (ZOOMED)
https://tos.mx/68o07Ax 15MC SRP 1145AM ET USA

RELATIVELY POSITIVE OVERNIGHT BIAS AND MORNING BIAS INTO TODAY'S LSE CLOSE AFTER POSITIVE USM SEMI-RECOVERY BIAS IN SPX IN LAST HOUR FROM FUTURES CLOSING LOW. INDICATES ONGOING RETAIL PARTICIPANT RISK-ON APPETITE AND BIAS . HOWEVER SUGGEST CONSIDERATION OF MAINTAINANCE OF HEDGE-ON IN PROTECTED RISK-ON BIAS AND CAUTION REGARDING POTENTIAL CYCLICAL FULFILLMENT POSSIBILITY ON AEV AND QEV INDICATORS... PARTICULARLY IF ALSO INDICATED AFTER FOMC ANNOUNCEMENT PGRAM SQUARINGS...
___________________________________________________________________________________
SEE PRIOR POSTS FOR RELATED ALERTS, CONTEXTING, AND FRAMING
FROM MDPP PRECISION PIVOTS, OPTIONPIVOTSLIVE, AND MARKETPIVOTSTV
AND
FROM THE MARKET PIVOTS FORECASTER AND ACTIVE ADVANCE POSITION AND RISK
MANAGEMENT NEWSLETTER, FREE ONLINE CONSOLIDATED VERSION
AND FROM MARKETINVESTORSWEEKLY.COM, AND THE MARKET ALPHA NEWSLETTERS GROUP
AND FROM THE ECHOVECTOR TECHNICAL ANALYSIS ASSOCIATION'S CONTRIBUTING MEMBERSHIP
AND
FOR FOCUS INTEREST OPPORTUNITY PERIOD SCENARIO SETUP OPPORTUNITY
FRAMINGS AND INDICATIONS, AND FOR OTHER SIGNIFICANT SUPPLEMENTAL MARKET
INTELLIGENCE PROVIDED FOR OUR PROFESSIONAL ASSOCIATED MEMBERSHIP
(AND
FOR OUR EXTENDED GLOBAL READERSHIP)
FOR ONGOING CONTEXTING, FRAMING, STUDY,ING AND REVIEW! ___________________________________________________________________________________
DISCLAIMER:
This post and all content and presentations included are for educational and informational purposes only. There
can be significant risks involved with investing including loss of
principal. There is no guarantee that the goals or the strategies and
examples discussed will be achieved. NO content published by us on the
Site, our Blogs, Newsletters, and any Social Media we engage in
constitutes a recommendation that any particular investment strategy,
security, portfolio of securities, or transaction is suitable for any
specific person. Further understand that none of our bloggers,
information providers, App providers, or their affiliates are advising
you personally concerning the nature, potential, value or suitability of
any particular security, portfolio of securities, transaction,
investment strategy or other matter. Again, this post is for educational
and informational purposes only. BEFORE MAKING ANY INVESTMENT DECISIONS
WE STRONGLY ENCOURAGE YOU TO FIRST CONSULT WITH YOUR PERSONAL FINANCIAL
ADVISOR.----------------------------------------------------------------------------------------------------------------------------
ADDENDUM 1: MODEL NOMENCLATURE AND METHODOLOGY NOTES
PIVOT POINT CALCULATION AND CONSTRUCTION SESSION
ILLUSTRATING THE TIME CYCLE PIVOT POINT INDICATORS AND THEIR
KEY SREV CFEV "S/R" SUPPORT/RESISTANCE PIVOT POINT PRICE FORECAST
PROJECTION
ECHOVECTORS WITHIN THE TIME CYCLE ECHOVECTOR PIVOT POINT PRICE FORECAST
PROJECTION PARALLELOGRAM, AND KEY ACTIVE TIME CYCLE PIVOT POINT PRICE
FORECAST PROJECTION S/R CHANNEL, AND THE ACTIVE ADVANCED POSITION AND
RISK MANAGEMENT OTAPS VECTOR SIGNAL CONSTRUCTION.
KEY ACTIVE AND TIMELY S&P500 SPX SPY ETF /ES EMIN FUTURES
PIVOT POINTS INDICATORS - 4-YEAR PRESIDENTIAL TIME CYCLE ECHOVECTOR
(PCEV), 2-YEAR CONGRESSSIONAL TIME CYCLE ECHOVECTOR (CCEV), ANNUAL TIME
CYCLE ECHOVECTOR (AEV), AND
KEY ACTIVE SUBSUMPTIVE TIME CYCLES [EG., QUARTERLY TIME CYCLE (QEV),
MONTHLY TIME CYCLE (MEV), WEEKLY TIME CYCLE (WEV), ETC.) AND THEIR
ASSOCIATED ECHOBACKPERIODS AND COORDINATE
FORECAST ECHOVECTOR SUPPORT AND RESISTANCE VECTORS (CFEVs, SREVs) AND FORECAST PROJECTED ECHOVECTOR PIVOT POINT LEVEL AND TIMING IMPLICATIONS ARE OFTEN HIGHLIGHTED AND
ILLUSTRATED!
PRESENTED BY THE MDPP PRECISION PIVOTS GLOBAL FINANCIAL MARKETS LABORATORY!
================================================
ADDENDUM 2: MODEL NOMENCLATURE AND METHODOLOGY NOTES
ECHOVECTOR TECHNICAL ANALYSIS ASSOCIATION - EVTAA.COM
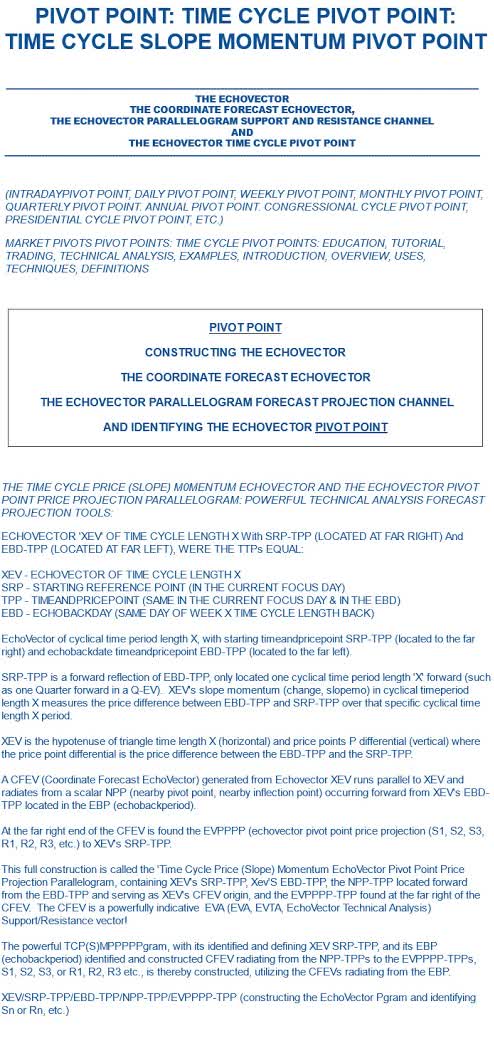
THE TIME CYCLE PRICE (SLOPE) MOMENTUM ECHOVECTOR AND ECHOVECTOR PIVOT POINT PRICE PROJECTION PARALLELOGRAM:
POWERFUL TECHNICAL ANALYSIS FORECAST PROJECTION TOOLS:
ECHOVECTOR XEV OF TIME CYCLE LENGTH X With SRP-TPP (LOCATED ON FAR RIGHT) And EBD-TPP (LOCATED ON FAR FAR LEFT).
XEV - ECHOVECTOR OF TIME CYCLE LENGTH X
SRP - STARTING REFERENCE POINT (IN CURRENT FOCUS DAY)
TPP - TIMEANDPRICEPOINT (IN CURRENT FOCUS DAY & EBD)
EBD - ECHOBACKDATE (SAME DAY OF WEEK, X TIME CYCLE LENGTH BACK)
EchoVector of cyclical time period length X, with
starting timeandpricepoint SRP-TPP (to the far right) and echobackdate
timeandpricepoint EBD-TPP (to the far left).
SRP-TPP is a forward reflection of EBD-TPP, only located
one cyclical time period length 'X' forward (such as one Quarter forward
in a Q-EV). XEV's slope momentum (change, slopemo) in cyclical time
period length X measures the price difference between EBD-TPP and
SRP-TPP over that specific cyclical time length X period.
XEV is the hypotenuse of triangle time length X
(horizontal) and price points P differential (vertical) where the price
point differential is the price difference between the EBD-TPP and the
SRP-TPP.
A CFEV (Coordinate Forecast EchoVector) generated from
EchoVector XEV runs parallel to XEV and radiates from a scalar NPP
(nearby pivot point, nearby inflection point) occurring forward from
XEV's EBD-TPP located in the EBP (echobackperiod).
At the far right end of the CFEV is found the EVPPPP
(EchoVector Pivot Point Price Projection (S1, S2, S3, S4, R1, R2, R3,
R4, etc.) to XEV's SRP-TPP.
This full construction is called the 'Time Cycle Price
(Slope) Momentum EchoVector Pivot Point Price Projection Parallelogram,
containing XEV's SRP-TPP, Xev'S EBD-TPP, the NPP-TPP located forward
from the EBD-TPP and serving as XEV's CFEV origin, and the EVPPPP-TPP
found at the far right of the CFEV.
The CFEV is a powerfully indicative EVA
Support/Resistance vector! The powerful TCPSMPPPPPgram, with its
identified and defining XEV SRP-TPP, and its EBP (echobackperiod)
identified and constructed CFEV, radiating from the NPP-TPPs to the
EVPPPP-TPPs, (S1, S2, S3, S4, R1, R2, R3, R4, etc.), is thereby constructed.
XEV SRP-TPP/EBD-TPP/NPP-TPP/EVPPPP-TPP (Sn Or Rn)
----------------------------------------------------------------------------------------
*AGAIN THIS
POST MAY INCLUDE POST MASTERS AND POST DOCTORAL LEVEL EDUCATIONAL AND
DISSERTATIVE INFORMATION, AND PROFESSORIAL TUTORIAL CONTEXTING AND
REFERENCING, WITHIN THE TECHNICAL FIELDS OF MARKET BEHAVIORAL ECONOMICS,
FINANCIAL MARKET PIVOTS TECHNICAL ANALYSIS, AND ADVANCED FINANCIAL
PHYSICS, DISSEMITATIVELY.
POSTING UPDATES ALSO FROM - MARKETPIVOTSTV SP500TV AND OPTIONPIVOTSLIVE (OPL)


PROVIDING PORTIONS OF THIS WEEK'S KEY POWERFUL FORWARD
EVTAA
EDUCATIONAL MARKET CONTEXTING
AND ILLUSTRATIVE SCENARIO SETUP OPPORTUNITY INDICATING
VISUAL TIME CYCLE INTENSIVE TECHNICAL ANALYSIS FRAMING...
POWERFUL
EVTAA CONTEXTING - TUTORIAL FORECAST PROJECTION SCIENCE AND ACTIVE
ADVANCE POSITION AN RISK MANAGEMENT MARKET INTELLIGENCE
NOW PROVIDED FREE ONLINE!

----------------------------------------------------------------------------------------------------------------------------------------
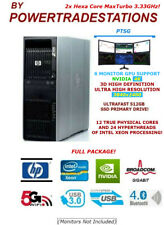
THANKING THIS MONTH'S APPRECIATED SPONSOR
POWERTRADESTATONS AND POWERTRADESTATIONSGLOBAL

BE
SURE LOOK FOR THE POWERTRADESTATION IMPRIMATUR ON EACH TRADING COMPUTER
LISTING TO MAKE SURE YOU ARE PURCHASING A GENUINE POWERTRADESTATION!
"We Put Our Traders And Their Success First!"
POWERTRADESTATONS AND POWERTRADESTATIONSGLOBAL
"Experienced
traders & trader technicians working with traders for traders to
help enable traders & investors to make better trades!"
Striving
to Provide Both Excellence & Economy In Proven Extended Market
Visibility Supporting Financial Tradestations, To Help Our Traders
Advance!"
"Optimizing Intelligence, Performance And Price For Our Traders Globally! "
Thanking Our Sponsors POWERTRADESTATIONS And POWERTRADESTATIONSGLOBAL...
65
results
Save this search
___________________________________________________________________________________
AGAIN, SEE PRIOR POSTS FOR RELATED ALERTS AND KEY CONTEXTUALIZATIONS
FROM MDPP PRECISION PIVOTS, OPTIONPIVOTSLIVE, AND MARKETPIVOTSTV
AND
FROM THE MARKET PIVOTS FORECASTER AND ACTIVE ADVANCE POSITION AND RISK
MANAGEMENT NEWSLETTER, FREE ONLINE CONSOLIDATED VERSION
AND
FOR FOCUS INTEREST OPPORTUNITY PERIOD SCENARIO SETUP OPPORTUNITY
FRAMINGS AND INDICATIONS, AND FOR SIGNIFICANT SUPPLEMENTAL MARKET
INTELLIGENCE, PROVIDED FOR OUR PROFESSIONAL ASSOCIATED MEMBERSHIP'S (AND
FOR OUR EXTENDED GLOBAL READERSHIP'S)
ADVANTAGE AND REFERENCE, AND FOR THEIR EXTENDED CONTEXTING, STUDY AND REVIEW! ___________________________________________________________________________________
NARRATION SHORTHAND ABBREVIATIONS AND KEY ALGO REFERENCES
The
(1) Time Cycle Forecast Projection EchoVector 'Slope Momentum
Trajectory Indicative' Pivot Point Price Projection Parallelogram, And
(2)The Active Advanced Position And Risk Management OTAPS Position Polarity Action Signal Support&Resistance Channel,
And (3) Key FIOP SSOI TPP (& Price Extension Estimate) 'I/O
FORECAST PROJECTION BIAS ACTION OPPORTUNITY BOX' Periods, And (4)
Cyclically Compiled Key EchoVector Lenghted Subsumption Period Lengths,
Phases, and Wave Formations And Indicative Components - - And Their Base
Taxonomy And Starting Shorthand Reference Algorithms...
P - Price
EV - EchoVector
XEV - EchoVector of time cycle length X (with slope momentum delta P over delta X)
SRP - EchoVector Starting Reference Time/Price Point (The far right point located along and EchoVector)
WEV - One Week Lengthed EchoVector, Weekly EchoVector Period Length
PCEV - 4 Year lengthed EchoVector, Presidential Cycle Echovector
H - Hourly, M - Monthly, Q - Quarterly, A - Annual, CC - 2 Year Congressional Cycle Length
4HEV - 4 Hour Lengthed EchoVector
TP - Timepoint; time premium when referencing Derivative Option Rider Vehicle Baskets
TPP - Time and Price Point along a slope momentum trajectory EchoVector
EBP - EchoVector EchoBackPeriod
EBD - EchoVector EchoBackDay
EBDTPP
- EchoBackDate TimeandPricePoint (The far left point along a slope
momentum EchoVector, x length from the SRP. The SRP is the EBD-TPP's
'reflection' located X length time cycle distance forward from the
EBD-TPP.)
NPP - Nearby forward pivot point from the EchoBackDay TPP
CFEV - EVA Coordinate Forecast Projection EchoVector
PGRAM
- The TIME CYCLE ECHOVECTOR SLOPE MOMENTUM TRAJECTORY Pivot Point Price
Projection Parallelogram Construction Support & Resistance Channel
EVA - EchoVector Analysis
EVTA - EchoVector Financial Markets Technical Analysis
EVTAA -Financial Markets Time Cycle EchoVector Technical Analysis Association
---------------------- ALPHABETICAL ----------------------
AMPEX - amplified price extension vector from correlate in ebp
B - broadcast, broadcasting
BB - bounce back
BO - Breakout
BOB - Back On Bias, resuming a designated and aforementioned forecast projection slope momentum trajectory bias
BP - Basis Points
BTV - EVA breakthrough vector, YELLOW SPACED
BT - breakthrough
C - call option
CCW - counter-clockwise echovector rotation
CFD - echovector current focus day
CFW - echovector current focus week
CGC - Capital Gain Capture
CGL - Capital Gain Lock
CHMK - EVA Checkmark Pattern
CL - closing tradeblock low
CL15 - Options closing period 4:00-4:15 ET USA;. also oc15 and ocp15
CD30M - closing tradeblock end less 30 minutes
CPI - consumer price index
CRV - call rider vehicle, esoteric basket, hedge insurance instrument
CW - clockwise echovector rotation
DC - Daily Candle
DC - bounce with no sustaining quality, and setting up lower low.
DBOX - EVA diamond box pattern
DERIV - derivative, option, esoteric, future
DIA - dow30 index etf
DOM - depth of market
DP - price down-pressure
DSMT - DownSide Momentum Target
DSP(iv) - downside pivot, pivot to short
D30 - Dow Jones 30 Composite Index
E - Echo
EBD - EchoBackDate
EQUIL - EVA equilibration
/ES - sp500 composite index emini futures
ESO - esoteric, derivative, option basket, weeklys
ET - Eastern Time USA
EVPPPP Echovector Pivot Point Price Projection; s1 s2 s3 s4 s5 etc., r1 r2 r3 r4 r5 etc., within key fiop timeblock/timeframe
F15 - Futures, last 15 minutes
FC15 - Last 15 minutes of futures trading before the close
FCRUM - fulcrum hour/period
FFPF - Focus Forecast Projection Framecharts
FHOPI - Full Hedge On Price Level Insurance
FIOP - EVA focus interest opportunity period
FOMC - Federal Reserve Bank Open Market Committee
FORV - Focus Options Rider Vehicle Basket
FORVS - Focus Options Rider Vehicles
FP - Forecast Projection
FPB - Forecast Projection Bias
FRB - US Federal Reserve Bank
FRI - Friday
FRV - focus rider vehicle basket, fcrv focus call rider vehical, fprv focus put rider vehicle
FSE - Frankfurt Stock Exchange, RMHO 2am ET USA
FUT15 - Key GREV TPP 300pm-315pm USM futures closing 15 minute period (CBOE, etc.)
GREV - EVA global rotation echovector
H - high (often price high, referring to a candle or TB)
HC - Hourly Candle
HEV - Hourly EchoVector
(24HEV - 24 Hour EchoVector
HOR - horizontal, horizontal pivot point indicator vector, horizontal'ing
HSE - Hong Kong SE
ID - identified, designated,
IDR - intraday reversal
IT - INSIDE THE...
INTD - Intraday
INTERD - interday or interweek or intermonth or interperiod
INTRA - intraday
I/O Box- eva price/time inside/outside forecast projection risk management reference action box, zoomed scalar spot
JAJO - January April July October Quarterly Cycle Phase
K - Key
KA - KEY ACTIVE
KORP - key otaps with reversal potential bias
KR - key reversal
KRR - key reversal at resistance [Pivot/Inflection/OTAPS Point R (1,2,3,4,5,6,7... etc)]
KRS - key reversal at support [Pivot/Inflection/OTAPS Point S (1,2,3,4,5,6,7... etc)]
LB - long bias
LOAD - high volume supply at price level
LSE - London Stock Exchange
LSP(iv) - long side pivot, pivot to upside
M - minute(s)
MC - minute candle, eg., 3mc is 3 minute candle(s)
MEV - Monthly EchoVector
MFTBB - Momentum Forward Trade Block (size) Bias (direction)
MIN - minute(s)
MINC - minute candle, eg., 3minc is 3 minute candle(s)
MMS - market makers
MOMO - momentum, momentum period, 2nd derivative momentum top
MORN - morning
MTB - MainTradeBlock
NL - net short
NPA - not presently available
NPP - Nearby Pivot Point
O - OPEN, OPENING
OBV - on balance volume
OC15 - Options closing period 4:00-4:15 ET USA
OH - opening tradeblock high
OL - opening tradeblock low
OPL OptionPivotsLive
OPT - option, options
ORV - Options Rider Vehicle Basket
OOTM - out of the money option
OTAPS
- EVA source 1 (cfev) or source 2 generated position polarity switch
signal vector application (Advanced straddle basket application - Google
"OTAPS).
On/Off/Through Target Position Polarity (long, short)
Application Price Switch Signal Vector, often generated by the PGRAM
CFEV (source 1)
P - put Option
PAR - par, parity
PEB - price equivalency basis
PFP - EVA powerful forecast projection
PFPBROT - Powerful Forecast Projection Bias (Long/Short, UP/DP, RS/RW) Right On Target
PGRAM - echovector time cycle slope momentum trajectory pivot point price projection parallelogram
PNLOP - potential net log opportunity period
PPI - Pivot Point Indicator; or, Producer Price Index
PRE-M - Pre-Market Hours
PREM-4AM - Key GREV TPP, Pre-Market Hours early Electronic Open (USM Access)
PRESS - pressure, intraday press to find intermediate wave price level floor or ceiling
POT - pressure on/off tape
PP - pivot point
PPROG - programmed, pre-programmed
PRE - before, premium
PR - key scalar related price run (extension[s]) after related origin inflection point reference.
PRV - put rider vehicle, esoteric basket, hedge insurance instrument
PV,OPV
- pointer vector. Price of option points to value of underlying at time
of expiration. Vector pointing there from underlying's price at time of
option exchange print price quote.
qev - Quarterly EchoVector in Quarterly Period Lengthed PGRAM (13 Weeks between CFD and EBD
QQQ - nasdaq 100 technology etf
R - Resistance, Resistance Level, Pivot/inflection/OTAPS Point R (1,2,3,4,5,6,7... etc)
REM - remember
REPO - repositioning, rolling into new or updated position complex
REV - reversal
REX - reduced price extension vector from correlate in ebp
RMH - regular market hours
RMHC - regular market hours close
RMHO - regular market hours open
RNR - forecast-ed move underway dramatically
ROT - right on forecasted target within echovector rotation; return on capital
RS - relative price strength
RVB - Reversal Bias
RW - relative price Weakness
RWS - relative weakness inflection points or periods
RV - options rider vehicle basket
S - Support, Support Level, Pivot/inflection/OTAPS Point S (1,2,3,4,5,6,7... etc)
SIG - signal, significant
SLOPEMO - PGRAM XEV and cfev slope momentum trajectory
SP - spaced
SPY - sp500 index etf
S/R - support/resistance
SS - scenario setup
SSOI - Scenario Setup Opportunity Indication
SSP(iv) - pivot to short, down-side pivot
ST - short term
SUP - Support, Support Level, Pivot/inflection/OTAPS Point S (1,2,3,4,5,6,7... etc)
SYMTRA - symmetry transpostiion, symmetry transposed vector schedule
T - time; tick; Tuesday; tradeblock
TB - Time Trade Block
TCPSM - time cycle price (slope) momentum
THO - though
TPP - TimeAndPricePoint
TRAJ - price trajectory of xev, cfev, npp vector, otaps vector, options pointer vector, slopemo vector
TSE - Tokyo Stock Exchange
TT - teeter totter
TTTE - Today's Tomorrow Trader's Edge
TU - Tuesday
TUE - Tuesday
TUES - Tuesday
UP - price up-pressure
UPD - update
UW - upwave
USM - United States Market, ie., NYSE & CBOE Etc
USP(IV) - upside pivot, pivot to long
W - Wednesday
WED - Wednesday
WKLY - weekly
WWW - EVA Wilbur Winged W Pattern
YEL - yellow
/YM - dow 30 composite index emini futures
Z - zoomed perspective
> - then or greater than
_________________________________________________________________________________
ADDITIONAL ADDENDUMS
_________________________________________________________________________________
Again Thanking Our Special Sponsors
POWERTRADESTATIONS And POWERTRADESTATIONSGLOBAL...
Items in search results
-
Pre-Owned
-
$829.00
-
or Best Offer
-
+$22.51 shipping
-
Pre-Owned
-
$545.00
-
or Best Offer
-
+$61.04 shipping
-
Xeon x5680 3.6GHz CPU Blows Away 3.7GHz E3-1245 by 27%!
Pre-Owned
-
$445.00
-
Buy It Now
-
+$22.51 shipping
-
HIGHLY POPULAR! "GET THE BEST FROM THE BEST!"
Pre-Owned
-
$549.00
-
Buy It Now
-
+$22.51 shipping
-
Summer SuperSale! 3.46GHz! Nvidia GPU! WIFI!
Pre-Owned
-
$679.00
-
or Best Offer
-
+$22.51 shipping
-
NVIDIA 4K GPU Support! 3DHD 3840x2160 UHRes SuperSale!
Pre-Owned
-
$589.00
-
or Best Offer
-
+$22.51 shipping
-
HP Deluxe! Power Up! "Get the Best From the Best!"
Pre-Owned
-
$999.00
-
or Best Offer
-
+$61.91 shipping
-
12 True Cores! 24 Hyperthreads! 4K GPU! Don'tBeFooled!
Pre-Owned
-
$745.00
-
or Best Offer
-
+$22.89 shipping
-
Pre-Owned
-
$659.00
-
or Best Offer
-
+$61.04 shipping
-
Pre-Owned
-
$369.00
-
Buy It Now
-
+$22.51 shipping
-
Pre-Owned
-
$739.00
-
or Best Offer
-
+$48.83 shipping
-
Pre-Owned
-
$339.00
-
Buy It Now
-
+$22.51 shipping
-
Pre-Owned
-
$629.00
-
or Best Offer
-
+$59.49 shipping
-
2022 SuperSale! Nvidia 3D 4K 3840x2400 Support!
Pre-Owned
-
$370.00
-
Buy It Now
-
+$22.51 shipping
-
Pre-Owned
-
$385.00
-
or Best Offer
-
+$22.51 shipping
-
5GWIFI/Bluetooth/SuperSpeed3.0 USB/2x 3.33GHz MaxTurbo!
Pre-Owned
-
$749.00
-
Buy It Now
-
+$48.83 shipping
-
Pre-Owned
-
$759.00
-
or Best Offer
-
+$61.91 shipping
-
Pre-Owned
-
$235.00
-
Buy It Now
-
+$22.51 shipping
-
Pre-Owned
-
$859.00
-
or Best Offer
-
+$59.49 shipping
-
Pre-Owned
-
$469.00
-
Buy It Now
-
+$22.51 shipping
-
Xeon x5680 3.6GHz CPU Blows Away 3.7GHz E3-1245 by 27%!
Pre-Owned
-
$445.00
-
Buy It Now
-
+$22.51 shipping
-
Pre-Owned
-
$349.00
-
Buy It Now
-
+$22.51 shipping
-
Pre-Owned
-
$389.00
-
or Best Offer
-
+$22.51 shipping
-
Pre-Owned
-
$799.00
-
or Best Offer
-
+$61.91 shipping
-
Pre-Owned
-
$789.00
-
or Best Offer
-
+$61.91 shipping
-
Get The Best From The Best! POWERTRADESTATIONSGLOBAL!
Pre-Owned
-
$525.00
-
Buy It Now
-
+$22.51 shipping
-
Pre-Owned
-
$359.00
-
Buy It Now
-
+$59.49 shipping
-
Pre-Owned
-
$899.00
-
or Best Offer
-
+$61.91 shipping
-
Pre-Owned
-
$539.00
-
or Best Offer
-
+$48.04 shipping
-
Pre-Owned
-
$589.00
-
Buy It Now
-
+$48.04 shipping
-
96GB RAM! NViIDIA 4K SUPPORT! DVDRW! WIFI!
Pre-Owned
-
$889.00
-
or Best Offer
-
+$61.91 shipping
-
Xeon x5680 3.6GHz CPU Blows Away 3.7GHz E3-1245 by 27%!
Pre-Owned
-
$389.00
-
Buy It Now
-
+$22.51 shipping
-
Pre-Owned
-
$875.00
-
Buy It Now
-
+$61.91 shipping
-
Pre-Owned
-
$739.00
-
or Best Offer
-
+$22.51 shipping
-
Pre-Owned
-
$385.00
-
Buy It Now
-
+$22.51 shipping
-
Pre-Owned
-
$399.00
-
Buy It Now
-
+$22.51 shipping
-
FEBRUARY SUPERSALE LISTING! Get The Best From The Best!
Pre-Owned
-
$599.00
-
or Best Offer
-
+$22.51 shipping
-
Spring SuperSale! Nvidia 3D 4K 3840x2400 Support!
Pre-Owned
-
$430.00
-
Buy It Now
-
+$22.51 shipping
-
Pre-Owned
-
$589.00
-
Buy It Now
-
+$22.51 shipping
-
Pre-Owned
-
$535.00
-
Buy It Now
-
+$22.51 shipping
-
Pre-Owned
-
$389.00
-
Buy It Now
-
+$22.51 shipping
-
Pre-Owned
-
$375.00
-
Buy It Now
-
+$22.51 shipping
-
Pre-Owned
-
$379.00
-
Buy It Now
-
+$22.51 shipping
-
Pre-Owned
-
$525.00
-
Buy It Now
-
+$22.51 shipping
-
Pre-Owned
-
$789.00
-
or Best Offer
-
+$61.91 shipping
-
Pre-Owned
-
$349.00
-
Buy It Now
-
+$22.51 shipping
-
Pre-Owned
-
$380.00
-
Buy It Now
-
+$22.51 shipping
-
Pre-Owned
-
$489.00
-
Buy It Now
-
+$61.91 shipping
-
Pre-Owned
-
$629.00
-
or Best Offer
-
+$48.04 shipping
-
Pre-Owned
-
$715.00
-
or Best Offer
-
+$61.91 shipping
-
Pre-Owned
-
$789.00
-
or Best Offer
-
+$22.51 shipping
-
12 True Cores! 24 Hyperthreads! 4K GPU! Don'tBeFooled!
Pre-Owned
-
$725.00
-
or Best Offer
-
+$22.51 shipping
-
5GWIFI Bluetooth 4 SS 3.0 USB 3.46GHz DVD W10P 4K
Pre-Owned
-
$815.00
-
or Best Offer
-
+$48.83 shipping
-
12 True Cores! 24 Hyperthreads! 4K GPU! Don'tBeFooled!
Pre-Owned
-
$699.00
-
or Best Offer
-
+$22.51 shipping
-
Pre-Owned
-
$719.00
-
or Best Offer
-
+$22.89 shipping
-
Pre-Owned
-
$699.00
-
or Best Offer
-
+$22.51 shipping
-
Pre-Owned
-
$779.00
-
or Best Offer
-
+$22.89 shipping
-
Pre-Owned
-
$679.00
-
or Best Offer
-
+$61.91 shipping
-
Pre-Owned
-
$699.00
-
or Best Offer
-
+$61.91 shipping
-
Pre-Owned
-
$789.00
-
or Best Offer
-
+$61.91 shipping
Items in search results
-
Pre-Owned
-
$849.00
-
or Best Offer
-
+$61.91 shipping
-
Pre-Owned
-
$799.00
-
or Best Offer
-
+$61.91 shipping
-
Pre-Owned
-
$719.00
-
or Best Offer
-
+$22.89 shipping
-
Pre-Owned
-
$859.00
-
or Best Offer
-
+$59.49 shipping
-
Pre-Owned
-
$725.00
-
or Best Offer
-
+$61.91 shipping
___________________________________________________________________________________
AGAIN, SEE PRIOR POSTS FOR RELATED ALERTS AND KEY CONTEXTUALIZATIONS
FROM MDPP PRECISION PIVOTS, OPTIONPIVOTSLIVE, AND MARKETPIVOTSTV
AND
FROM THE MARKET PIVOTS FORECASTER AND ACTIVE ADVANCE POSITION AND RISK
MANAGEMENT NEWSLETER, FREE ONLINE CONSOLIDATED VERSION
AND
FOR FOCUS INTEREST OPPORTUNITY PERIOD SCENARIO SETUP OPPORTUNITY
FRAMINGS AND INDICATIONS, AND FOR SIGNIFICANT SUPPLEMENTAL MARKET
INTELLIGENCE, PROVIDED FOR OUR PROFESSIONAL ASSOCIATED MEMBERSHIP'S (AND
OUR GLOBAL READERSHIP'S) ADVANTAGE, REFERENCE, STUDY, AND REVIEW ___________________________________________________________________________________


 Watch
Watch