MARKET PIVOTS FORECASTER AND ACTIVE ADVANCED POSITION AND RISK MANAGEMENT NEWSLETTER

THE REST OF THE MARKET ALPHA NEWSLETTERS GROUP


"Positioning for change; staying ahead of the curve; we're keeping watch for you!"


Currently The Leading And Regularly Updated And FREE Online Consolidated Newsletter Version Of "The Market Pivots Forecaster", Featuring Today's MARKET PIVOTS And Time Cycle PIVOT POINT Forecast Projections And Indicators, And PIVOT POINT FrameCharts And Illustrations, By MDPP PRECISION PIVOTS, In Association With The Market Alpha Newsletters Group And BrightHousePublishing.Com. Providing Valuable And Timely Market Price Path Analysis And Price Forecast Projection FrameCharts And PIVOT POINT Timing Indicators, Advanced Time Cycle PIVOT POINT Indicator EchoVectors, Key Time Cycle PIVOT POINT EchoVector Echo-Back-Dates, Key Active Time Cycle PIVOT POINT Projection Coordinate Forecast EchoVectors And EchoVector Support And Resistance Vectors, And Advanced Forecast EchoVector PIVOT POINT Projections And Inflection Points For Select Market Composite Indexes, ETFs, Options, And Futures In Stocks, Bonds, Commodities, Currencies, And Emerging Markets, With A Strong Focus And Emphasis On Select, Proxying And Indicative Market Sector Indexes, ETFs, Options, And Emini Futures Instruments In Key Markets.


With


THE ETF PIVOTS FORECASTER AND ACTIVE ADVANCED POSITION AND RISK MANAGEMENT NEWSLETTER


And


THE EMINI PIVOTS FORECASTER AND ACTIVE ADVANCED POSITION AND RISK MANAGEMENT NEWSLETTER


And


THE OPTION PIVOTS FORECASTER AND ACTIVE ADVANCED POSITION AND RISK MANAGEMENT NEWSLETTER


And With


"THE REST OF THE MARKET ALPHA NEWLSETTERS GROUP'S ACTIVE ADVANCED POSITION AND RISK MANAGEMENT NEWSLETTERS"

THE MARKET ALPHA NEWSLETTERS GROUP'S FREE CONSOLIDATED ONLINE VERSION SITE

PROTECTVEST AND ADVANCEVEST

PROTECTVEST AND ADVANCEVEST BY ECHOVECTORVEST MDPP PRECISION PIVOTS

"Positioning for change, staying ahead of the curve, we're keeping watch for you!"

OUR RESEARCHING VIEWERSHIP

OUR ACTIVE ADVANCED PROFESSIONAL FINANCIAL POSITION AND RISK MANAGEMENT RESEARCHING VIEWERSHIP NOW INCLUDES RESEARCHERS IN OVER 100 COUNTRIES FROM AROUND THE WORLD! INCLUDING...


Afghanistan/ Angola/ Argentina/ Australia/ Austria/ Azerbaijan/ Bahamas/ Bahrain/ Bangladesh/ Belarus/ Belgium/ Belize/ Bermuda/ Botswana/ Brazil/ Burma/ Cambodia/ Cameroon/ Canada/ Caymen Islands/ Chile/ China/ Columbia/ Costa Rica/ Croatia/ Cyprus/ Czech Republic/ Denmark/ Ecuador/ Egypt/ El Salvador/ Equatorial Guinea/ Estonia/ France/ Finland/ Germany/ Greece/ Guam/ Guernsey/ Hong Kong/ Hungary/ India/ Indonesia/ Iraq/ Ireland/ Israel/ Italy/ Jamaica/ Japan/ Jordan/ Kazakhstan/Kenya/ Korea/ Kuwait/ Latvia/ Lithuania/ Luxembourg/ Macau/ Macedonia/ Malaysia/ Malta/ Mexico/ Moldova/ Mongolia/ Morocco/ Myanmar (Burma)/ Namibia/ Nepal/ Netherlands/ New Zealand/ Nicaragua/ Nigeria/ Norway/ Oman/ Panama/ Pakistan/ Peru/ Philippines/ Poland/ Portugal/ Qatar/ Romania/ Russia/ Saudi Arabia/ Serbia/ Seychelles/ Singapore/ Slovakia/ South Africa/ Sri Lanka/ Spain/ Sweden/ Switzerland/ Taiwan/ Thailand/ Togo/ Trinidad and Tobago/ Tunisia/ Turkey/ Turkmenistan/ Ukraine/ United Arab Emirates/ United Kingdom/ United States/ US Virgin Islands/ Uzbekistan/ Venezuela/ Vietnam/ Zimbabe/ And More!

PROTECTVEST AND ADVANCEVEST BY ECHOVECTORVEST ARTICLE GLOBAL PUBLICATION AND SYNDICATION

PROTECTVEST AND ADVANCEVEST BY ECHOVECTORVEST ARTICLE GLOBAL PUBLICATION AND SYNDICATION
PROTECTVEST AND ADVANCEVEST BY ECHOVECTORVEST MDPP PRECISION PIVOTS ARTICLES HAVE APPEARED IN PUBLICATION OR IN SYNDICATION IN YEARS 2012 TO 2022 AT

GLOBAL OUTLETS AND TERMINALS

Nasdaq, CNBC, MSN Money, Yahoo Finance, MarketWatch, Reuters, Barrons, Forbes, SeekingAlpha, Market Pivots Forecaster, BizNewsToday, Benzinga, Business Insider, Daily Finance, StreetInsider, Top10Traders, Fixed Income and Commodities, EchoVectorVEST, Financial Visualizations, YCharts, XYZ Trader Systems, ZeroHedge, Predict WallStreet, Market-Pivots, Financial RoundTable, Financial Board Central, Bullfax, BizWays, BizFeedz, StockFlash, MoneyShow, TradingView, Investor Hangout, StockPicksExpert, The Finance Spot, Business News Index, Regator, Streamica, BusinessBalla, Finanzachricten, StockLeaf, News Now UK, The Economic Times, Finance Pong, Seeking Alpha Japan, Yahoo Finance Australia, Yahoo Finance New Zealand, Yahoo Finance Canada, Yahoo Finance Singapore, Gold News Today, GoldPivots, Casey Research, AurumX, Sharps Pixley News, Royals Metal Group, A-Mark Precious Metals, SBG Direct, Horizontal Metals, GoldSilverMoney, Sterling Investment Services, Prompto Capita, Silver Investor Weekly, Austin Rare Coins and Bullion, GoldPivots, Gold Trend, GoldPrice Today, Gold Rate 24, Check Gold Price, Gold Investor Weekly, Silver Price News, Silver News Now, Silver Phoenix 500, Silver News, Silver Price, Silver Prices Today, SilverPivots, Precious-Metals, VestTrader, Value Forum, Coin Info, Investment Four You, AidTrader, Trend Mixer, Indonesian Company, SiloBreaker, ETF Bannronn, SportBalla, Trading Apples, Skeptical Market Observer, Pension Plus, Fixed Income And Commodities, Collateral Finance Corporation, One Page News, EarthBlogNews, NewsFlashy, Veooz News, Wopular, Open Box Experiment, US Government Portal, Do It Yourself Investor, The Atlanta Journal Constitution, News Blogged, and others.

THE MARKET ALPHA NEWSLETTERS GROUP -- CONSOLIDATED FREE ONLINE VERSIONS -- PREMIUM DESKS POSTS


On special occasions, the popular MarketPivotsTV Worldwide Broadcast, featuring real-time active advanced SP500TV and OptionPivotsLive market intelligence, may become temporarily available, free online, utilizing any common browser with NO NEED FOR ANY ADDITIONAL APP DOWNLOADS OR OPERATING APPLICATIONS, and, instead, available directly and simply through your everyday browsers! On these special broadcast occasions, simply open up your preferred browser (eg., Edge, Firefox, Google, etc.) on any screened device such as phone, notebook, laptop, desktop, TV, etc., and access MarketPivotsTV directly at URL address screenleap.com/marketpivots and, if you like, sign in both free and anonymously! Simply use an anonymous psuedo-name such as Anonymous1, Anonymous2, Anonymous3, etc., to sign in and view! Limited seats are available during these special free access opportunity occasions! Experience the power and advantage of live MDPP Precision Pivots "Trader's Edge" advanced market intelligence, including streaming and select focus forecast projection framecharts and live active advanced scenario setups on MarketPivotsTV! Sponsored by The MDPP Precision Pivots Global Financial Markets Laboratory, The EchoVector Technical Analysis Association, MarketInvestorsWeekly, The Market Pivots Forecaster And Active Advanced Position And Risk Management Newsletter, The Market Alpha Newsletters Group, SP500TV, OptionPivotsLive and by special sponsors POWERTADESTATIONS and POWERTRADESTATIONSGLOBAL!
Special Discalimer: All broadcasts on MarketPivotsTV and content in this post are for educational and informational purposes only. There can be significant risks involved with investing including loss of principal. There is no guarantee that the goals or the strategies and examples presented or discussed will be achieved. NO content provided on MarketPivotsTV, on this Site, our Blogs, Newsletters, and any Social Media MarketPivotsTV or we engage in constitutes a recommendation that any particular investment strategy, security, portfolio of securities, or transaction is suitable for any specific person. Further understand that MarketPivotsTV and none of our bloggers, information providers, App providers, or their affiliates are advising you personally concerning the nature, potential, value or suitability of any particular security, portfolio of securities, transaction, investment strategy or other matter. Again, all broadcasts on MarketPivotsTV and content in this post are for educational and informational purposes only. BEFORE MAKING ANY INVESTMENT DECISIONS WE STRONGLY ENCOURAGE YOU TO FIRST CONSULT WITH YOUR PERSONAL FINANCIAL ADVISOR.

FRAMECHART EXAMPLES: DAY, 2D, 5D, 10D, MONTH, QUARTER, 2Q, YEAR, 2Y, 4Y, MORE (Click And Refresh)

THE MARKET PIVOTS FORECASTER AND ACTIVE ADVANCED POSITION AND RISK MANAGEMENT NEWSLETTER


THE MARKET ALPHA NEWSLETTERS GROUP FREE ONLINE CONSOLIDATED NEWSLETTERS VERSION


BY MARKETINVESTORSWEEKLY.COM AND BRIGHTHOUSEPUBLISHING.COM!

TODAY'S POSTS

POST REFERENCE INDEX

QUICK REFERENCE INDEX TO THIS MONTH'S, THIS YEAR'S, AND BACK YEARS' POSTS

TODAY'S MOST RECENT MDPP PRECISION PIVOTS PREMIUM DESKS RELEASE POST NOW FREE ONLINE

TODAY'S MOST RECENT MDPP PRECISION PIVOTS PREMIUM DESKS RELEASE POST NOW FREE ONLINE
ANALYSIS, ALERTS, OTAPS SIGNALS, CHART ILLUSTRATIONS, AND COMMENTARY

Monday, April 30, 2012


MAJOR MARKET ALERT:  US Large Cap Stock Composite Indexes and other Major Market US Stock Indexes

EG.:  SPY, SPX,  DJX, DIA,, QQQ, $RUT, IWM, $DJIA, $OEX, $XMI,

FRIDAY, APRIL 27, 2012


ProtectVEST 2012 Major Market Large Cap ALERT Issued Today: Presidential Cycle EchoVector, Congressional Cycle EchoVector, Annual Cycle echoVector, and All Four Quarterly Cycle EchoVectors Active In ALERT Input Generation: "Sell In May and Go Away" Annual Cycle EchoVector and Presidential Cycle EchoVector Input Pressures Strongly Active


Possible Regime Change Cycle EchoVector Consequences.

Major 2012 Full Net Portfolio Insurance on US Stock Market Major Market Index Exposures issued today by ProtectVEST by EchoVectorVEST, MDPP.

A Current USO ETF EchoVector And EchoBackDate Price Analysis: Is Seasonal Price History Unfolding Again?

A Current USO ETF EchoVector And EchoBackDate Price Analysis: Is Seasonal Price History Unfolding Again?  [Edit or Delete]0 comments

Apr 30, 2012 11:03 PM
A Current USO ETF EchoVector And EchoBackDate Price Analysis: Is Seasonal Price History Unfolding Again?
April 29, 2012 2:35 PM
Recently there has been a tremendous amount of interest and much media attention given to the energy markets, and particularly to the markets for crude oil and gasoline.
The seasonal February-through-April 'price strength period' unfolded and manifested itself once again this year, and with usual its usual price vigor.
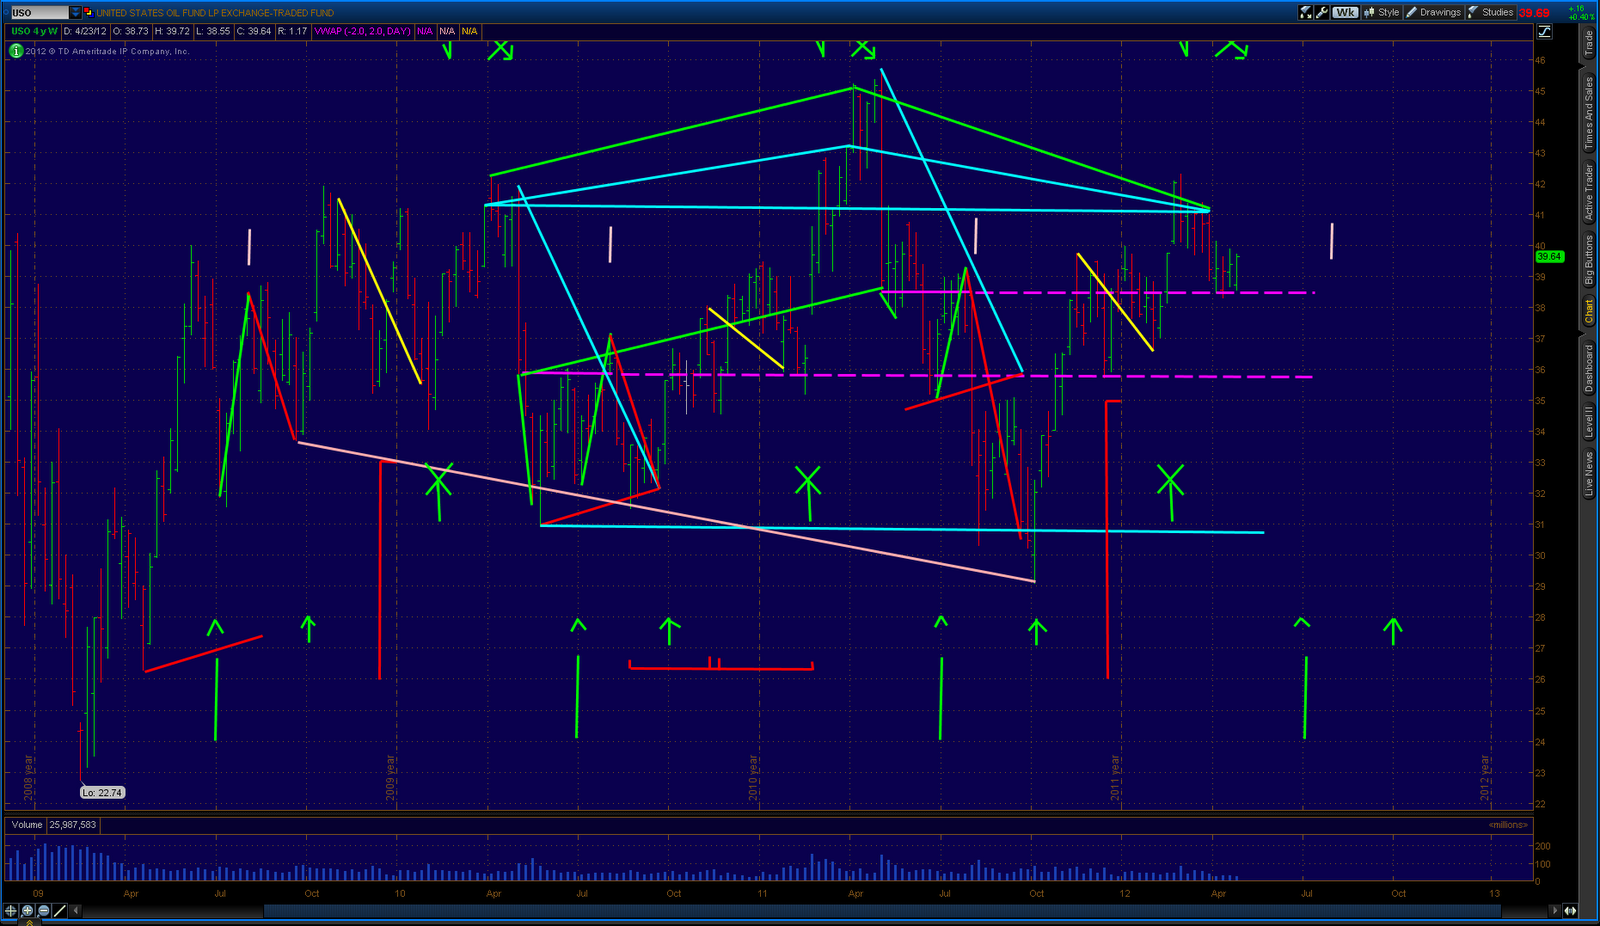
Provided below is a chart with an excellent graphical illustration of this year's 'price seasonalities' in the USO ETF.
Also shown and marked on the chart are the many regular and repeating annual price 'ebbs and flows' experienced in the USO ETF the last several years.
A close examination of the chart may significantly aid the portfolio manager, and the trader, in their management of USO ETF positions, analysis, and reasoned forecasts, and perhaps also with other USO-related ETF's and commodity futures and indexes. Especially if their analysis includes or emphasizes seasonal and historical conditions and price patterns... and relevant echovectors.
Following the USO ETF price chart below I have listed some 'suggestive analytical perspectives', and some key 'notes of interest'.
Upon review of this chart and its technical indications, prepared caution in the near-term regarding the USO ETF's present price level, and going forward the next several weeks, may well be in order.
_________________________________________________________
USO ETF Chart
4-Year Weekly OHLC Chart
With Key Active Annual EchoVectors And Annual EchoBackWeeks's Highlighted:
(Click on chart and click again to enlarge and zoom)
On Chart Above: Suggestive Analytics and Key Notes of Interest:
1. Be aware of month 4 in the Annual and Bi-Annual Cycles
2. Note first 3 weeks of month 5.
3. Note the 'price level low' of the first week of May, and how it proves to be 'around top or close to sell-down price level,' occurring at end of July and beginning of August's 'mid-2/-3rd week's summer top.'
4. Be aware of momentum reversal at the end of September and the beginning of October, after downside price consolidation.
5. Be aware of the 'about one quarter earlier in time' momentum bottom occurring at the end of June/early July. Note that reversal is good for first month, of three subsequent months, leading to October, and failing around beginning of August. This forms a cone with June/July and September/October bottoms with an August 'pointed top'.
6. In our view, these are significant seasonal relative strength reversal periods and indicators. EchoVectors and EchoVector EchoBackDates are significant in the analysis, forecast, and current price and price level measurements here.
7. Note the importance of week 6 low and the week 9 high, and sell-off from week 9 to week 11, in the 'Winter Quarter EchoVector (following the prior fall and summer quarterly weekly High and Low weekly momentum pattern deltas, within a quarterly and bi-quarterly echovector and echobackvector analysis, focusing on key echobackweek highs and lows.
Within your own working analytic frame, retopologize the 3-Year OHLC daily price action charts for further definition and precision revelation, and then retopologize those further to 'hourly intra-day and further discrete price action for even further 'resolution and revelation'. Then overlay this data with regular announcement schedule information, special inventory and/or production announcement information occurrences, and further with related macro-event impacting announcements... all for increased and even further definition, forecast, and management insight and effectiveness.
Disclosure: I am short USO.
Themes: etf-analysis

SPX Presidential Cycle Election Year And Congressional Cycle Election Year GuideChart Illustrating the "Sell In May And Go Away!" Wall Street Phenomena and the Subsequent Stock Market Composite Price Level Drop.


ProtectVEST's Instablog

| Write a new Instablog post
See: http://advancevest.com/untitled1.html Kevin John Bradford Wilbur is the President and Founder of ProtectVest and AdvanceVest by EchoVectorVest. He is also the Chief Architect of the Motion Dynamics and Precision Pivots Forecast Model and Alert Paradigm, and the Senior Developer of the... More
My company:
ProtectVEST and AdvanceVEST by EchoVectorVEST
My blog:
ProtectVEST and AdvanceVEST by EchovectorVEST, MDPP

View ProtectVEST's Instablogs on:

  • SPX Presidential Cycle Election Year And Congressional Cycle Election Year GuideChart Illustrating The "Sell In May And Go Away!" Wall Street Phenomena And The Subsequent Stock Market Composite Price Level Drop. [Edit or Delete]
    Provided below is a graphical display of the professionally favored and broadly watch Large Cap Stock Market Index, the $SPX.
    The SPX is the favored index, and "general stock market measure" used by professional analyst and investment managers both domestically and globally. It is held as the predominate and most representative measure of the US Large Cap Securities Market.
    Presented below is a GuideChart of the SPX which illustrates the effects of the (1) Presidential Election Cycle and the (2) Congressional Election Cycle on the price level of the SPX.
    In this illustration, I am focusing particularly on the effect of the old Wall Street adage "Sell in May and Go Away", and how this adage is (1) illustratively pronounced in Presidential Election Cycle years and Congressional Cycle Years, and (2) how it can lead to the start of, and cascade into a precipitous and major Stock Market selloff's in Regime Change Cycle Election years (which are usually every eight years, but can occur, post facto, in four years as well.)
    Also illustrated is how immediately preceding annual echovector cycles can also foreshadow the May selloff (see the May 2011 and May 2010 echovectors highlighted in beige)
    READING SPX GUIDECHART:
    1. Click on the Chart and then Click again to both enlarge and zoom the chart. Use your optimum display settings also.
    2. The SPX GuideChart is a 10-Year Weekly OHLC (Open/High/Low/Close) Price Bar chart
    3. The Congressional Election Cycle is displayed in alternate yellow and agua-blue vectors, in order to discern every two years along the chart from the key First Trading Week of May bar and its high price more clearly.
    4. The selloff from the first week of May to the traditional 2ND or 3RD Week of August is displayed with a red vector. The white bars located under Congressional Cycle or located on the weekly OHLC (Open/High/Low/Close) price bar line also display these annual sell-off sums.
    5. In solid green are the correlate dates of the weekly bars beginning the selloff the first trading week in May for the cycle years.
    6. In solid red are the correlate dates of the weekly bars completing the selloff sum at that time. Notice that in many cycle years 'lower lows' are achieved before this date.
    7. The horizontal solid pink line illustrates how the SPX has achieved the nearly perfect correlate price level to May four years earlier, on aweekly closing price basis. This is often referred to as a resistance price levelvector (with respect to the expressed specific time quantity (in this case, being four years).
    8. The eight-year long dotted-green lines represent key price vectors and ascending price channels identified by EchoVectorVEST MDPP.
    9. Notice the magnitude of the selloff from (1) the first week in May of Regime Change Cycle Election year, or, (2) as measured from its preceding year's summer price high.
    We hope this chart helps demonstrate the prudence of applying price level insurance to major market funds and ETFS. These funds and ETFs typically comprise a large portion of overall portfolio exposure existing under passive professional management regiments and affiliations.
    The historical reward-to-risk ratio of proceeding beyond THE FIRST WEEK OF MAY without 'major stock market exposed' portfolio price level 'insurance' applications, or proceeding to just continue along within 'full uninsured passive portfolio management portfolio exposures', would seem imprudent and potentially counter-productive to overall accrued, and time-already-spent-earned, portfolio value.
    In the present era of active and advance financial management and financial position and holdings value optimization techniques, better price protection strategies and portfolio management and portfolio value enhancement opportunities are available.
    ___________________________________________________________
    SPX 10-Year Weekly OHLC GuideChart
    (click to enlarge)
    Disclosure: I am short SPY.

Friday, April 27, 2012

Why The Federal Reserve Elected to "Talk Up" the Economy and Therefore the Markets this Week.

Below is a five year weekly OHLC chart of the DJX, the 1/100TH of the Dow Jones 30 Industrial Average.  This chart highlights Key Presidential Cycle EchoVectorVEST EchoVectors and 4-year EchoBackDates in 2008 for the current 2012 market year. It also includes some key annual EchoVectorVEST EchoVectors and 1-year EchoBackDates in 2011 for the present 2012 market year which are currently in force (as a result of 'follow through' to key 2010 EchoVectors and 1-year EchoBackDates to the 2011 market year.

The chart is very revealing.  "In pink" notice the current PCEV and PCEVEBD period we are currently entering.  Also notice the current key AEV and AEVEBD, and last years springtime upward momentum finish we are currently entering  "in short-line aqua-blue".  Also note 'in solid horizontal green' notice the 'price equivalency basis recovery level' we have now achieved on the PCEV for this week.

In red and green 'spaced-lines' are illustrated various PCEVs and PCEVEBDs that came into play in last year's "spring and summer price level swoon" on the PCEV basis, and their 'pivotings' through quarters.  The 'co-ordination' of these highlighted and key PCEVs and PCEVEBDs (on the weekly OHLC charting basis) is quite remarkable, especially regarding various near-term relative strength and relative weakness 'price echoes.'

It was not in the Federal Reserves current monetary expansion policy and therefore "accounting unit value amplification and magnification efforts" to see a precipitous conclusion to the upward price momentum and 'wealth effect' on the Presidential Cycle and Annual Cycle basis this week, so talking up  the market at this key critical juncture and level ensued.

However, will 'talk' be sufficient to prevent the powerful  market forces of these cycle price cycles and echovectors from fulfilling themselves going forward from this week on a PCEV and an AEV basis, especially with all the uncertainties in politics, geopolitics, macroeconomics, and employment currently being considered.

 Full Net Portfolio Current Price Level Insurance (FNPI) may be considered particularly timely, on a risk-reward basis, now, and going forward into May 2012... and beyond.

EchoVectorVEST Lexical References:

PCEV           Presidential Cycle EchoVector
PCEVEBD   Presidential Cycle EchoVector EchoBackDate
AEV             Annual Cycle EchoVector
AEVEBD     Annual Cycle EchoVector EchoBackDate

FNPI            Full Net Portfolio Insurance (Price Level Hedge)


DJX: 1/100TH of the Dow Jones 30 Industrial Average
5-Year Weekly OHLC

Key Presidential Cycle EchoVectorVEST EchoVectors
Key 4-Year EchoBackDates
Key Annual EchoVectorVEST EchoVectors for 2012 and 2011.
Key 1-Year EchoBackDates for 2012 and 2011

(Click on chart and click again to enlarge and zoom)


ProtectVEST and AdvanceVEST by EchoVectorVEST
Divisions of Motion Dynamics and Precision Pivots
Bradford Market Research and Analytics

"We're keeping watch for you!"


USO ETF Trader's Edge Master EasyGuideChart by ProtectVEST and AdvanceVEST by EchoVectorVEST, MDPP

Current USO ETF Trader's Edge EasyGuideChart By ProtectVEST And AdvanceVEST, EchoVectorVEST, MDPP


April 27, 2012

Current USO ETF EchoVector and EchoBackDate Price Analysis:  by ProtectVEST and AdvanceVEST by EchoVectorVEST

There has been a tremendous amount of interest and much media attention given to the energy markets recently, particularly to to the market prices of crude oil and gasoline.  The 'seasonal' February through April price strength period has manifested itself yet once again this year with vigor.

Provided below is an excellent graphical illustration of this year's price seasonality, and much more.  Provided also is a significant graphical illustration of the many regular annual price 'ebbs and flows' experienced in the USO ETF the last several years.

A close examination of the chart below can significantly aid the portfolio manager and the trader in the management of their market position analysis and responsibilities and their resasonable forecasts in the USO ETF, and related ETF's, and commodity futures, and indexes with an emphasis on seasonal and historical conditions and historical price patterns... and echovectors.


Key notes of interest and suggestive analysis are presented below the chart.


ProtectVEST and AdvanceVEST by EchoVectorVEST
Divisions of Motion Dynamics and Precision Pivots
Bradford Market Research and Analytics

"We're keeping watch for you!"


USO ETF 
Trader's Edge Master EasyGuideChart

4-Year Weekly OHLC Chart

With Key Active Annual EchoVectors And Annual EchoBackWeeks's Highlighted:

EchoBackWeeks 
EchoBackDates
EchoBackPoints
EchoBackPeriods, and 
EchoVectors


On Chart Above:


1. Be aware of monh 4 in the Annual and Bi-Annual Cycles  


2. Note first 3 weeks of month 5.


3. Note the 'price level low' of the first week of May, and how it  proves to be 'around top or close to sell-down price level,' occuring at end of July and beginning of August's 'mid-2/-3rd week's summer top.'


4. Be aware of momentum reversal at the end of September and the beginning of October, after downside price consolidation.


5. Be aware of the 'about one quarter earlier in time' momentum bottom occuring at the end of June/early July.   Note that reversal is good for first month, of three subsequent months, leading to October, and failing around beginning of August.  This forms a cone with June/July and Sept/Oct bottoms with an August 'pointed top'.


6. In our view, these are significant seasonal relative strength reversal periods and indicators.  EchoVectors and EchoVector EchoBackDates are significant in the analysis, forecast, and current price and price level measurements here.


7. Note the importance of week 6 low and the week 9 high, and sell-off from week 9 to week 11, in the Winter EchoVector Quarter (following the prior fall and summer quarterly weekly High and Low weekly momentum pattern deltas, withinin a quarterly and bi-quarterly echovector and echobackvector analysis, focusing on key EchoBackWeek highs and lows.


Within your own working analytic frame, re-topologize the 3 -Year OHLC daily price action charts for further definition and precision revelation,  and then re-topologize those further to 'hourly intra-day and further discrete price action for even further 'resolution and revelation'.  Then  overlay this data with regular announcement schedule information, special inventory and/or production announcement information occurances, and further with related macro-event impacting announcements...  all for increased and even further definition, forecast, and management insight and effectiveness.


See www.EchoVectorVEST.Blogspot.com
www.echovectorvest.com
www.motiondynamicsandprecisionpivots.com


ProtectVEST and AdvanceVEST by EchoVectorVEST
Divisions of Motion Dynamics and Precision Pivots
Bradford Market Research and Analytics

"We're keeping watch for you!"

This article is tagged with: ETF Analysis


PAGEVIEWS BY COUNTRY - TOP TEN COUNTRIES

Pageviews by Countries

Graph of most popular countries among blog viewers
EntryPageviews

United States

57668

Russia

17373

France

8896

Germany

8033

Ukraine

7370

China

4411

Malaysia

1891

Turkey

1735

Brazil

1297

Poland

976
LOOK FOR THIS WEEK'S KEY, AND POTENTIALLY POWERFUL RETURN, OPTIONPIVOTS.COM (WEEKLYS) ACTIVE ADVANCED MANAGEMENT FOCUS INTEREST OPPORTUNITY VIRTUAL FORECAST AND ALERT SCENARIO SETUP PRESENTATION AND POST -- ON THE SPY, DIA, QQQ, IWM GLD, SLV, TLT, TBT, AND/OR USO PROXIES. AT LEAST ONE KEY PREMIUM DESKS RELEASED FOCUS FORECAST SCENARIO AND STRATEGY OPPORTUNITY ILLUSTRATION TENDS TO APPEAR AND BE PUBLISHED "FREE ONLINE" EACH WEEK
SEE THIS WEEK'S
OPTIONPIVOTS.COM (WEEKLYS) FREE ONLINE VERSION KEY FOCUS INTEREST OPPORTUNITY FORECAST SCENARIO, STRATEGY, AND ALERT SETUP, AND CORRESPONDING ANALYSIS FRAMECHARTS, GUIDEMAPS, TRADENOTES AND COMMENTARY BY MARKET INVESTOR WEEKLY (OPTIONPIVOTS.COM WEEKLYS FOCUS) AT "THE MARKET PIVOTS FORECASTER AND ACTIVE ADVANCED POSITION AND RISK MANAGEMENT NEWSLETTER, PREMIUM DESKS RELEASES NOW FREE ONLINE CONSOLIDATED MANG VERSION

BY THE MARKET ALPHA NEWSLETTERS GROUP, AND BY BRIGHTHOUSE PUBLISHING
OPTIONPIVOTS.COM (WEEKLYS)

Optionpivots.com Posts, Focus TRADER'S EDGE EVPPA Forecast FrameCharts, OTAPS-PPS Active Advanced Management Position Polarity Signal Vector GuideMaps, Alerts, Tradenotes and Commentary With Key Focus Interest Oppportunity EVPPA Data-Mined Forecast Scenario Setup And Strategy Analysis And Illustration For The Current Week And/Or Beyond.

Coming key short-term short and/or short-term long echovector pivot point analysis forecast scenario setup based interday or intraday optionpivots.com weeklys focus interest opportunity points, periods, and extensions.

EXAMPLE MDPP PRECISION PIVOTS MODEL AND PARADIGM GENERATED VIRTUAL OPPORTUNITIES PRESENTED, FRAMED, DISCUSSED, HIGHLIGHTED, AND ILLUSTRATED FOR THE WEEK, WITH CAPITAL GAIN RESULTS SUMMARIZED

KEY FORECAST AND STRATEGY SCENARIO FOCUS PROXY INSTRUMENTS:

SPY, /ES
DIA, /YM
QQQ, /NQ
IWM, /TF
TLT, /ZB, /US
TBT, /ZN, /TY
GLD, /GC
SLV, /YI
USO, /QM, /CL


ACTIVE ADVANCED RISK MANAGEMENT OTAPS-PPS ALERTS

Introducing the Active Advanced Risk Management On/Off/Through Vector Target Application Price Switch. Position Management and Value Optimization Technology. See "OTAPS" Link Above Right.

ACTIVE ADVANCED POSITION MANAGEMENT DOUBLE LEVERAGE AND DOUBLE-DOUBLE LEVERAGE ALERTS

Introducing PROTECTVEST AND ADVANCEVEST Active Advanced Management (A) Double and (B) Double-Double Positioning Technology For Select Instruments and Key Focus Interest Opportunity Periods. See Links Above Right.

OPTIMIZING LEVERAGE RETURNS WITH DERIVATIVES AND SYNTHETICS

Introducing The PROTECTVEST AND ADVANCEVEST Active Advance Derivatives Management Levels 1, 2, 3 , And 4 Technology For Position Value Hedging and Value Optimizing Strategies. See The Derivatives Baskets Reference Guide Link And Levels Link Above Right.

ECHOVECTOR TECHNICAL ANALYSIS ASSOCIATION

THE TIME CYCLE PRICE MOMENTUM ECHOVECTOR PIVOT POINT PRICE PROJECTION PARALLELOGRAM - KEY TIME CYCLE LENGTHS


KEY ELEMENTAL STOCHASTICS CYCLE PHASE INPUTS: Economic Calendar, Earning Calendar, Options Expiration Calendar, Futures Expiration Calendar, FRB Announcement And Release Calendar - Federal Open Market Committee Calendar, Political Cycle Calendar, Global Markets Intra-day Rotation Calendar - Opens & Closes & Key Time and Time Block Wave High & Lows, etc.


2HEV 2 Hour EchoVector

4HEV 2 Hour EchoVector

6HEV 6 Hour EchoVector

8HEV 8 Hour EchoVector

12HEV 12 Hour EchoVector

24HEV 24 Hour EchoVector

48HEV 48 Hour EchoVector

72HEV 72 Hour EchoVector

WEV Weekly EchoVector

2WEV Bi-Weekly EchoVector

MEV Monthly EchoVector

2MEV Bi-Monthly EchoVector

QEV Quarterly Echovector

2QEV Bi-Quarterly EchoVector

AEV Annual EchoVector

2AEV 2 Year EchoVector Congressional

PCEV 4 Year EchoVector Presidential

FRBEV 5 Year EchoVector Federal Reserve Bank

SEV 6 Year EchoVector Senatorial

RCCEV 8 Year EchoVector Regime Change

MCEV 16 year EchoVector Maturity