


PIVOT POINT INDICATORS, DAILY PIVOT POINT INDICATORS, WEEKLY PIVOT POINT INDICATORS, BI-WEEKLY PIVOT POINT INDICATORS, MONTHLY PIVOT POINT INDICATORS, QUARTERLY PIVOT POINT INDICATORS, BI-QUARTERLY PIVOT POINT INDICATORS, ANNUAL PIVOT POINT INDICATORS, CONGRESSIONAL CYCLE PIVOT POINT INDICATORS, PRESIDENTIAL CYCLE PIVOT POINT INDICATORS.
DAILY PIVOT POINT INDICATOR, 2 DAY PIVOT POINT INDICATOR, 3DAY PIVOT POINT INDICATOR, WEEKLY PIVOT POINT INDICATOR. TIME CYCLE PIVOT POINTS.
FRIDAY 3/25/22 8:00PM ET USA UPDATES: GET READY Y2022 Q1 WEEK 13!
PIVOT POINT INDICATORS
S&P500 SPY ETF AND /ES EMINI FUTURES - INSIDE THE QUARTERLY TIME CYCLE PIVOT POINT INDICATORS
XEV-SRP -TPP: REGULAR MARKET HOURS DAILY CANDLE HIGH (CYCLE LENGTH X, WITH STARTINGREFERENCEPOINT TIMEANDPRICEPOINT CANDLEPOINT DESIGNATION)
INSIDE THE QUARTERLY CYCLE - HOURLY CANDLES PERSPECTIVE
INSIDE THE MONTHLY CYCLE - 15 MINUTE CANDLES PERSPECTIVE
LAST WEEK'S FORWARD LOOK - PROJECTIONS OF KEY ECHOBACKDATE TIMEANDPRICEPOINTS SYMMETRY TRANSPOSED TO CURRENT FOCUS PERIOD STARTING REFERENCE POINT - SRP FRIDAY CLOSING HIGH SYMTRA PROJECTIONS - AEV, 2QEV, QEV, 2MEV, MEV, 2WEV, WEV
FRAMECHART BY MDPP PRECISION PIVOTS GLOBAL FINANCIAL MARKETS LABORATORY
FRAMECHART BY MDPP PRECISION PIVOTS GLOBAL FINANCIAL MARKETS LABORATORY
The "Today's Tomorrow Trader's Edge Focus Forecast Projection FrameChart GuideMap Grid Update Provided Above For The S&P500 SPY ETF Highlights and Illustrates the Key SRP TPP For Friday, 3/18/22, NYSE As: Regular Market Hours Daily Candle Closing High.
2. CONGRESSIONAL CYCLE LENGTH (CCEV) - SOLID AQUABLUE
3. ANNUAL CYCLE LENGTH (AEV) - SOLID PURPLE
4. BI-QUARTERLY CYCLE LENGTH (2QEV) - SOLID DEEP AQUABLUE
5. QUARTERLY CYCLE LENGTH (QEV) - THICK SOLID PURPLE
6. BI-MONTHLY CYCLE LENGTH (2MEV) - SOLID AQUABLUE
7. MONTHLY CYCLE LENGTH (MEV) - SOLID GREEN
8. WEEKLY CYCLE LENGTH (WEV) - THICK SOLID PURPLE
THIS WEEK'S FORWARD LOOK - PROJECTIONS OF KEY ECHOBACKDATE TIMEANDPRICEPOINTS SYMMETRY
TRANSPOSED TO CURRENT FOCUS PERIOD STARTING REFERENCE POINT - SRP FRIDAY
CLOSING HIGH SYMTRA PROJECTIONS - AEV, 2QEV, QEV, 2MEV, MEV, 2WEV, WEV.
FRAMECHART BY MDPP PRECISION PIVOTS GLOBAL FINANCIAL MARKETS LABORATORY
1. PRESIDENTIAL CYCLE LENGTH (PCEV) - THIN DOTTED NAVY BLUE
2. CONGRESSIONAL CYCLE LENGTH (CCEV) - SOLID AQUABLUE
3. ANNUAL CYCLE LENGTH (AEV) - SOLID BLACK
4. BI-QUARTERLY CYCLE LENGTH (2QEV) - SOLID DEEP AQUABLUE
5. QUARTERLY CYCLE LENGTH (QEV) - THICK SOLID GOLD
6. BI-MONTHLY CYCLE LENGTH (2MEV) - SOLID AQUABLUE
7. MONTHLY CYCLE LENGTH (MEV) - SOLID GREEN
8. BI-WEEKLY CYCLE LENGTH (WEV) - THICK SOLID DEEP AQUABLUE
9. WEEKLY CYCLE LENGTH (WEV) - THICK SOLID PURPLE
FRAMECHART BY MDPP PRECISION PIVOTS GLOBAL FINANCIAL MARKETS LABORATORY
TO ENLARGE AND FURTHER ZOOM 'TODAY'S TOMORROW TRADER'S EDGE' PIVOT POINT INDICATOR FOCUS FORECAST FRAMECHART SNAPSHOTS
(1) RIGHT CLICK ON THE PROVIDED SNAPSHOT AND 'OPEN IMAGE IN NEW TAB, AND THEN LEFT CLICK ON THE PLUS MAGNIFIER, OR
(2) LEFT CLICK ON THE PROVIDED SNAPSHOT LINK, THEN LEFT CLICK ON THE SNAPSHOT TO ENLARGE, THEN RIGHT CLICK TO FIND 'OPEN IMAGE IN NEW TAB' AND LEFT CLICK, THEN LEFT CLICK THE ZOOM MAGNIFIER.
FRAMECHART BY MDPP PRECISION PIVOTS GLOBAL FINANCIAL MARKETS LABORATORY
DISCLAIMER: This article is for educational and informational purposes only. There can be significant risks involved with investing including loss of principal. There is no guarantee that the goals or the strategies and examples discussed will be achieved. NO content published by us on the Site, our Blogs, Newsletters, and any Social Media we engage in constitutes a recommendation that any particular investment strategy, security, portfolio of securities, or transaction is suitable for any specific person. Further understand that none of our bloggers, information providers, App providers, or their affiliates are advising you personally concerning the nature, potential, value or suitability of any particular security, portfolio of securities, transaction, investment strategy or other matter. Again, this post is for educational and informational purposes only. BEFORE MAKING ANY INVESTMENT DECISIONS WE STRONGLY ENCOURAGE YOU TO FIRST CONSULT WITH YOUR PERSONAL FINANCIAL ADVISOR.
__________________________________________________________
PRIOR POST FOR ADDITIONAL CONTEXT, STUDY AND REVIEW __________________________________________________________
FRIDAY 3/18/22 8:00PM ET USA UPDATES: GET READY Y2022 Q1 WEEK 12, POST FRB FOMC ANNOUNCEMENT WEEK!
PIVOT POINT INDICATORS
S&P500 SPY ETF AND /ES EMINI FUTURES - INSIDE THE QUARTERLY TIME CYCLE PIVOT POINT INDICATORS
XEV-SRP -TPP: REGULAR MARKET HOURS DAILY CANDLE HIGH (CYCLE LENGTH X, WITH STARTINGREFERENCEPOINT TIMEANDPRICEPOINT CANDLEPOINT DESIGNATION)
INSIDE THE QUARTERLY CYCLE - DAILY CANDLES PERSPECTIVE
Special Contribution Edition

- Wednesday, the Federal Open Market Committee elects to raise the Prime Rate 1/4 point, as expected, and hints at the possibility of doing so again each scheduled meeting this year.
- After this FOMC Announcement, the S&P500 initially slumps; but, then bounces back well into the market close, as Fed Chairman Powell emphasizes relative income and consumer strength in the economy.
- The Congressional cycle, Annual cycle, Quarterly cycle, Bi-Monthly cycle, and Monthly cycle technical slope momentum price trajectories, in the S&P500, come into key alignments and synchronizations.
- The US stock market continues its positive 'Chairman Powell FedSpeak-led' strong bull rally from Wednesday right into Friday's close, this past week rallying nearly halfway back to its early January Y2022 Q1 all time highs, and shortly after recently revisiting areas near its first quarter correction lows!
- Traders ask if it is truly time to buy back into the US Large Cap Equities Composite Index again, or if 'further Fed hike headwinds' and potentially challenging macroeconomic fundamentals are still too strong.
- Has the stock market seen its lows for the quarter, and for the year, and is now heading to higher highs, or will it revisit recent quarterly lows, and perhaps even see lower lows before prior highs ... these questions are considered from and advanced 'time cycle inclusive' technical analysis forecast projection perspective?
THIS WEEK'S ECONOMIC CALENDAR HIGHLIGHTS - PROVIDED BY MARKETWATCH - Including Major U.S. Economic Reports & Fed Speakers
MONDAY, MARCH 21
8 am Atlanta Fed President Raphael Bostic speaks
8:30 am Chicago Fed national activity index Feb. -- 0.69
12 noon Fed Chair Jerome Powell speaks at NABE conference
TUESDAY, MARCH 22 None scheduled
WEDNESDAY, MARCH 23
10 am New home sales (SAAR) Feb. 820,000 801,000
THURSDAY, MARCH 24
8:30 am Initial jobless claims March 19 213,000 214,000
8:30 am Continuing jobless claims March 12 -- 1.42 million
8:30 am Durable goods orders Feb. -0.5% 1.6% 8:30 am Core capital goods orders Feb. -- 1.0%
8:30 am Current account deficit Q4 -$220 billion -$215 billion
9:45 am Markit manufacturing PMI (flash) March 56.8 57.3 9:45 am Markit services PMI (flash) March 56.8 56.5
FRIDAY, MARCH 25
10 am UMich consumer sentiment index (final) March 59.6 59.7 10 am 5-year inflation expectations (final) March -- 3.0% 10 am Pending home sales index Feb. 0.0% -5.7%
----------------------------------------------------------------------------------------------------------------------------
In this article, and within the context of this week's economic calendar, I will examine the most recently updated and released MDPP Precision Pivots Global Financial Markets Laboratory provided Today's Tomorrow Trader's Edge Focus Forecast Projection FrameCharts, presented below, and issued as recently as 3/20/22.
This
particular article is the most recent update, and issue, in the
globally popular and ongoing series of active advanced financial markets
behavioral economics, financial physics, and cyclical price focused
financial technical analysis presented on the S&P500 Composite Index
by this presenter.
These FrameCharts include illustrative and valuable technical analysis topological overlays the FINANCIAL MARKETS LABORATORY provided for market scholars, active advanced financial managers, and other market intelligence recipients.
Examining the FrameCharts, I have found very interesting UPDATED, useful and potentially actionable information regarding the S&P500 SPY ETF's key cyclical periods, common price directional bias and relative strength forward - within places in these periods - and importantly indicative pivot point observations, features,, and implications regarding the S&P500 SPY ETF's current price trending and near-term and intermediate term-cyclical price and cyclical relative strength outlooks. These are advanced market intelligence features and observations regarding the S&P500 SPY ETF's apparently active cyclical wave pattern formation and periodic characteristics and regularities, and its common cyclical inflection and pivot point timings, and its key periodic price momentum and price trajectory expressions (key cycles, included directional trends, and potentially recurrent and/or emerging price inflections and pivot points) within the context of stock market's ongoing economic calendar and earnings' calendar.
Utilizing this advanced market intelligence, with its presented cyclical forecast model time-and-price-point inflections and time-and-price pivot point projections... short-term trading opportunities and their implied active advanced position and risk management and actionable alpha enhancing opportunities, in coordination with key economic calendar and earnings calendar coordinations and events can be ascertained...especially when utilizing the 'a criterion of cyclical pivot point continuance' and its considerable potential influence within the forecast model framings and scenario setups.
IN
THIS ARTICLE, PRESENTED BELOW THE FOLLOWING ILLUSTRATIVE FINANCIAL
MARKETS RELEASED FRAMECHARTS, ARE THE LATEST UPDATES (TO DATE) IN
VALUABLE OBSERVATIONS, ANALYSIS, AND IMPORTANT MARKET INTELLIGENCE
PUBLISHED FOR THE BENEFIT OF RECIPIENT SCHOLARS, FINANCIAL
PROFESSIONALS, AND ACTIVIST MARKET PARTICIPANT READERS.
FRAMECHART BY MDPP PRECISION PIVOTS GLOBAL FINANCIAL MARKETS LABORATORY
Provided Above Is A "Today's Tomorrow Trader's Edge Focus Forecast Projection FrameChart GuideMap Grid Update For The S&P500 SPY ETF - SRP TPP Friday, 3/18/22, NYSE Regular Market Hours Daily Candle Closing High.
1. PRESIDENTIAL CYCLE LENGTH (PCEV) - THIN DOTTED NAVY BLUE
2. CONGRESSIONAL CYCLE LENGTH (CCEV) - SOLID AQUABLUE
3. ANNUAL CYCLE LENGTH (AEV) - SOLID PURPLE
4. BI-QUARTERLY CYCLE LENGTH (2QEV) - SOLID DEEP AQUABLUE
5. QUARTERLY CYCLE LENGTH (QEV) - THICK SOLID PURPLE
6. BI-MONTHLY CYCLE LENGTH (2MEV) - SOLID AQUABLUE
7. MONTHLY CYCLE LENGTH (MEV) - SOLID GREEN
8. WEEKLY CYCLE LENGTH (WEV) - THICK SOLID PURPLE
9. COORDINATE FORECAST ECHOVECTOR PROJECTION ACTIVE ADVANCED POSITION AND RISK MANAGEMENT OTAPS VECTORS - SPACED AND DOTTED
OBSERVATIONS, ANALYSIS, AND IMPORTANT MARKET INTELLIGENCE
Reviewing the 'Today's Tomorrow Trader's Edge Focus Forecast Projection FrameChart GuideMap Grid Update' provided by The MDPP Precision Pivots Global Markets Laboratory for S&P500 SPY ETF, we find in the quarterly cycle's ECHOBACKPERIOD (EBP) a noteworthy Monday 12/20/21 pivot point low which precedes a dramatic stock market rally, an important cyclical wave pattern formation implication to note.
In echovector time cycle technical analysis algorithmic terms, this cyclical pivot point recognition in the quarterly 'calendared' echobackweek (Y2021 Q4 WEEK 12) symmetry transposed ONE QUARTER LATER to the currently coming focus week (Y2022 Q1 WEEK 12 - CFW- Current Focus Week) would be expressed as the 'qev-ebd-tpp-symtra-wtcpppp [qevpppp] FROM Monday 12/20/21 FOR Monday 3/21/22. 'qev-ebd-tpp-symtra-wtcpppp [qevpppp] refers to "the quarterly echovector echo-back-day time-and-price-point symmetry-transposed forward, in the criteria cyclical definition continuance and wave pattern degreed reflection integrity, as the wilbur-time-cycle-pivot-point-price-projection [qevpppp]... a projected (measurement expected) value.
The coordinate and 'precisioned' cyclical TPP (time-and-price-point) of that Monday's low 'focus pivot time-and-price-point' can actually be be ZOOMED right to the minute and the second (and further with the right tools) within the stock market's trading day, and within its flow within the economic calendar too.
In continued review, what we find in the 1QEV EBW we also interestingly find in the 2QEV EBW, the 3QEV EBW and the 5QEV EBW regarding Monday's EBD lows within each of these key periodicities, and the weeks' price direction and average price extension... within the roughly annual zoom framechart perspective of the provided GuideMap Grid. The 6 month cycle often proves quite significant within the annual cycle, year over year. In all but the 2QEV EBP, positive market direction occurred during the two weeks forward from the cyclical 'Monday lows.'
However, we do note that a year ago (in the AEV EBW), after closing further up on Monday well off its Monday low, pressure 'remained on the tape' during the week well into its Wednesday/Thursday relative strength lows, before then launching forward. And Thursday/Friday came in quite positive in each periods EBW, important implications for short-term traders in derivatives and esoterics to note (yet always remembering Gauss, potential exogenous variable impacts to forecast model projection outcomes, and the requirements of effective stop protection science and applications for sequentially successful scenario setup opportunity yields and overall continued alpha string optimization).
As we look evermore closely at each our additional key cyclical periodicities, we can also cautiously mitigate, recognizing relative down-pressure does not completely 'come off the tape' until passing through several 'key cycle periodicities' EBW intraweek Wednesday/Thursday lows. We find this in some degree in the AEV EBW, the 2QEV EBW, the 2MEV EBW, the MEV EBW, and even manifested in 'undercurrent' in the bullish WEV EBW that we just experienced, intraday, within this past week's FRB Chair FedSpeak-led rally.
To be on the safe side, within our KEY ACTIVE ADVANCED MANAGEMENT HIGH ALPHA STRING ENHANCING CAPITAL GAIN CAPTURE PROTECTVEST AND ADVANCEVEST APPLICATIONS, we will set, and apply, each of our cyclically included coordinate forecast echovector projection (CFEV - spaced and dotted) OTAPS action vectors, and their targeted execution ladder steps, accordingly, for high alpha gain capital gain capture optimization, and for alpha sting enhancement... and let the real-time market print washes through our active advanced position and risk management setup in the coming week, as we pursue and net our advanced scenario setup and active advanced position and risk management gains from our historical data intensive and data coordinated ascertainments and preparations.
Interestingly, if we zoom out further yet, to include the 2-year Congressional cycle, we once again find interesting cyclical support in the week following each of these key monthly option expirations (MJSD - March, June, September, December), and their 'prior weeks' Wednesdays.
FRAMECHART BY MDPP PRECISION PIVOTS GLOBAL FINANCIAL MARKETS LABORATORY
These are powerful forecast projection bias implication and position management setups, within the criterion of continuance, regarding momentum and cyclical history price action, for intermediate term position management, and especially for shorter-term traders in derivatives and esoterics.
As mentioned earlier this week, we are inclined to be very observant of market price dynamics this week and into next, as we consider SPY ETF hedge insurance applications and techniques. In this regard, we remain incline to consider utilizing and placing "dynamic, active, and adjustable straddling positions in order to lock in gains and to better manage exposure to general market price level changes in either direction. Setting advanced management straddles at key coordinate forecast levels is a very effective and opportune approach, and an advanced position management and trading strategy. Using this approach at this time could prove very valuable in effectively managing both market risk and reward ahead. My general bias remains cautious. "Don't Fight The Fed" remains in force, and if the Fed begins the process of a relative de-leveraging of the markets compared to what it has been doing, it must proceed very smoothly, and very cautiously about what it takes away, and when and how. And we want to remain well prepared for any market reactions.
We will continue to closely watch the 2-year Congressional cycle echovector, the Annual cycle echovector, and each of the inclusive and key subsumptive cycle echovectors (Bi-Quarterly, Quarterly, Bi-monthly, Monthly, Weekly, etc.), for continued symmetries and confirming parallels and early divergent tells, and try to report them. And we will plan to keep calculating our echovector pivot points and employing our dynamic OTAPS On-Off-Through Vector Target Application Price Switch triggers as well.
Again, we hope you find today's valuable cyclical technical analysis based market intelligence update interesting, and its provided observations useful forward.
Thank you.
TO ENLARGE AND FURTHER ZOOM 'TODAY'S TOMORROW TRADER'S EDGE' PIVOT POINT INDICATOR FOCUS FORECAST FRAMECHART SNAPSHOTS
(1) RIGHT CLICK ON THE PROVIDED SNAPSHOT AND 'OPEN IMAGE IN NEW TAB, AND THEN LEFT CLICK ON THE PLUS MAGNIFIER, OR
(2) LEFT CLICK ON THE PROVIDED SNAPSHOT LINK, THEN LEFT CLICK ON THE SNAPSHOT TO ENLARGE, THEN RIGHT CLICK TO FIND 'OPEN IMAGE IN NEW TAB' AND LEFT CLICK, THEN LEFT CLICK THE ZOOM MAGNIFIER.
FRAMECHART BY MDPP PRECISION PIVOTS GLOBAL FINANCIAL MARKETS LABORATORY
DISCLAIMER: This article is for educational and informational purposes only. There can be significant risks involved with investing including loss of principal. There is no guarantee that the goals or the strategies and examples discussed will be achieved. NO content published by us on the Site, our Blogs, Newsletters, and any Social Media we engage in constitutes a recommendation that any particular investment strategy, security, portfolio of securities, or transaction is suitable for any specific person. Further understand that none of our bloggers, information providers, App providers, or their affiliates are advising you personally concerning the nature, potential, value or suitability of any particular security, portfolio of securities, transaction, investment strategy or other matter. Again, this post is for educational and informational purposes only. BEFORE MAKING ANY INVESTMENT DECISIONS WE STRONGLY ENCOURAGE YOU TO FIRST CONSULT WITH YOUR PERSONAL FINANCIAL ADVISOR.
Monday, 3/21/22 Update
Fed Chairman Powell Temporarily Cools Last Week's 'Post Rate Hike Rally' With Hawkish Statements Monday In Speech At NABE
- This past Wednesday, Fed Chairman Powell's accompanying post rate hike 'FedSpeak' rallied the stock market into a dramatically strong the weekly close; for the stock markets best weekly gain since late 2020! Then his surprisingly hawkish rate hike speech on Monday at NADE (The National Association Of Business Economics) helps temporarily cool the rally, giving many investors 'pause.'
- This
past Wednesday, the Federal Open Market Committee elected to raise the
Prime Rate 1/4 point, as expected, and hinted at the possibility of
doing so again each scheduled meeting this year. After this FOMC
Announcement, the S&P500 initially slumped; but, then bounces back
well into the market close, as Fed Chairman Powell emphasizes relative
income and consumer strength in the economy.
- The US stock market continued its positive 'Chairman Powell FedSpeak-led' strong bull rally from Wednesday right into Friday's close, this past week rallying nearly halfway back to its early January Y2022 Q1 all time highs, and shortly after recently revisiting areas near its first quarter correction lows!
- In 'pausing' the stock rally on Monday, Chairman Powell reveals that he is becoming more concerned with inflation, and indicates that greater than 'quarter-point rate hikes' this year may soon become quite possible.
- Traders ask if it is truly time to buy back into the US Large Cap Equities Composite Index again, or if 'further Fed hike headwinds' and potentially challenging macroeconomic fundamentals are still too strong.
- Has the stock market seen its lows for the quarter, and for the year, and is now heading to higher highs, or will it revisit recent quarterly lows, and perhaps even see lower lows before prior highs ... these questions are considered from and advanced 'time cycle inclusive' technical analysis forecast projection perspective?
THIS WEEK'S ECONOMIC CALENDAR HIGHLIGHTS - PROVIDED BY MARKETWATCH - Including Major U.S. Economic Reports & Fed Speakers
MONDAY, MARCH 21
8 am Atlanta Fed President Raphael Bostic speaks
8:30 am Chicago Fed national activity index Feb. -- 0.69
12 noon Fed Chair Jerome Powell speaks at NABE conference
TUESDAY, MARCH 22 None scheduled
WEDNESDAY, MARCH 23
10 am New home sales (SAAR) Feb. 820,000 801,000
THURSDAY, MARCH 24
8:30 am Initial jobless claims March 19 213,000 214,000
8:30 am Continuing jobless claims March 12 -- 1.42 million
8:30 am Durable goods orders Feb. -0.5% 1.6% 8:30 am Core capital goods orders Feb. -- 1.0%
8:30 am Current account deficit Q4 -$220 billion -$215 billion
9:45 am Markit manufacturing PMI (flash) March 56.8 57.3 9:45 am Markit services PMI (flash) March 56.8 56.5
FRIDAY, MARCH 25
10 am UMich consumer sentiment index (final) March 59.6 59.7 10 am 5-year inflation expectations (final) March -- 3.0% 10 am Pending home sales index Feb. 0.0% -5.7%
----------------------------------------------------------------------------------------------------------------------------
Fed Chairman Jerome Powel surprised member of the National Association Of Business Economics today, as well as the stock market, during his NABE speech, stating “The expectation going into this year was that we would basically see inflation peaking in the first quarter, then maybe leveling out... That story has already fallen apart. To the extent that it continues to fall apart, my colleagues and I may well reach the conclusion that we’ll need to move more quickly (on rate hikes).” And he proceeded to state directly “If we conclude that it is appropriate to move more aggressively by raising the federal funds rate by more than 25 basis points at a meeting or meetings, we will do so...” The stock market rally paused, and intraday the Dow 30 Industrials Index intraday sold off as much as 200 points, before recovering later in the afternoon, after the Fed Chairman had finished speaking.
Given this past week's rally following the Fed Chair's remarks that accompanied the FOMC interest rate hike, and then today's market rally 'pausing comments', stock market investors and traders are continuing to question whether the stock market has seen its lows for the quarter, and for the year, and is now heading to higher highs, or if it will revisit recent quarterly lows, and perhaps see even lower lows before ever returning to previous highs... and in what time frame? In this article I will address these questions from a 'data intensive' and advanced time 'cycle' inclusive technical analysis forecast projection based perspective utilizing FrameCharts provided by MDPP Precision Pivots and their time cycle illustrating and highlighting topology, and then applying advanced EchoVector Technical Analysis observations to the cyclical information provided on the Framecharts, within the context of this week's economic calendar,
The Framecharts I will utilize are the most recently updated and released Famecharts by The MDPP Precision Pivots Global Financial Markets Laboratory, provided as their signature Today's Tomorrow Trader's Edge Focus Forecast Projection FrameCharts editions, and issued as recently as Sunday, 3/20/22.
This particular article of mine is a special, and the most recent update, of my globally popular and ongoing series of active advanced financial markets behavioral economics, financial physics, and cyclical price focused financial technical analysis, presented on the S&P500 Composite Index, and provided for market scholars, active advanced financial managers, and other market intelligence recipients.
Examining the FrameCharts, I have found very interesting UPDATED, useful and potentially actionable information regarding the S&P500 SPY ETF's key cyclical periods, common price directional bias and relative strength forward - within places in these periods - and importantly indicative pivot point observations, features,, and implications regarding the S&P500 SPY ETF's current price trending and near-term and intermediate term-cyclical price and cyclical relative strength outlooks. These are advanced market intelligence features and observations regarding the S&P500 SPY ETF's apparently active cyclical wave pattern formation and periodic characteristics and regularities, and its common cyclical inflection and pivot point timings, and its key periodic price momentum and price trajectory expressions (key cycles, included directional trends, and potentially recurrent and/or emerging price inflections and pivot points) within the context of stock market's ongoing economic calendar and earnings' calendar.
Utilizing this advanced market intelligence, with its presented cyclical forecast model time-and-price-point inflections and time-and-price pivot point projections... short-term trading opportunities and their implied active advanced position and risk management and actionable alpha enhancing opportunities, in coordination with key economic calendar and earnings calendar coordinations and events can be ascertained...especially when utilizing the 'a criterion of cyclical pivot point continuance' and its considerable potential influence within the forecast model framings and scenario setups.
FRAMECHART BY MDPP PRECISION PIVOTS GLOBAL FINANCIAL MARKETS LABORATORY
The "Today's Tomorrow Trader's Edge Focus Forecast Projection FrameChart GuideMap Grid Update Provided Above For The S&P500 SPY ETF Highlights and Illustrates the Key SRP TPP For Friday, 3/18/22, NYSE As: Regular Market Hours Daily Candle Closing High.
1. PRESIDENTIAL CYCLE LENGTH (PCEV) - THIN DOTTED NAVY BLUE
2. CONGRESSIONAL CYCLE LENGTH (CCEV) - SOLID AQUABLUE
3. ANNUAL CYCLE LENGTH (AEV) - SOLID PURPLE
4. BI-QUARTERLY CYCLE LENGTH (2QEV) - SOLID DEEP AQUABLUE
5. QUARTERLY CYCLE LENGTH (QEV) - THICK SOLID PURPLE
6. BI-MONTHLY CYCLE LENGTH (2MEV) - SOLID AQUABLUE
7. MONTHLY CYCLE LENGTH (MEV) - SOLID GREEN
8. WEEKLY CYCLE LENGTH (WEV) - THICK SOLID PURPLE
9. COORDINATE FORECAST ECHOVECTOR PROJECTION ACTIVE ADVANCED POSITION AND RISK MANAGEMENT OTAPS VECTORS - SPACED AND DOTTED
OBSERVATIONS, ANALYSIS, FORECAST PROJECTION IMPLICATIONS, AND COORDINATED INVESTMENT APPROACH
Reviewing the 'Today's Tomorrow Trader's Edge Focus Forecast Projection FrameChart GuideMap Grid Update' provided by The MDPP Precision Pivots Global Markets Laboratory for S&P500 SPY ETF, we find in the quarterly cycle's ECHOBACKPERIOD (EBP) a noteworthy Monday 12/20/21 pivot point low which precedes a dramatic stock market rally, an important cyclical wave pattern formation implication to note.
In echovector time cycle technical analysis algorithmic terms, this cyclical pivot point recognition in the quarterly 'calendared' echobackweek refers to "the quarterly echovector echo-back-day time-and-price-point symmetry-transposed forward... and is a projected (measurement expected) value.
The coordinate and 'precisioned' cyclical TPP (time-and-price-point) of that Monday's low 'focus pivot time-and-price-point' can actually be be ZOOMED right to the minute and the second (and further with the right tools) within the stock market's trading day, and within its flow within the economic calendar too.
In continued review, what we find in the 1QEV EBW we also interestingly find in the 2QEV EBW, the 3QEV EBW and the 5QEV EBW regarding Monday's EBD lows within each of these key periodicities, and the weeks' price direction and average price extension... within the roughly annual zoom framechart perspective of the provided GuideMap Grid. The 6 month cycle often proves quite significant within the annual cycle, year over year. In all but the 2QEV EBP, positive market direction occurred during the two weeks forward from the cyclical 'Monday lows.'
However, we do note that a year ago (in the AEV EBW), after closing further up on Monday well off its Monday low, pressure 'remained on the tape' during the week well into its Wednesday/Thursday relative strength lows, before then launching forward. And Thursday/Friday came in quite positive in each periods EBW, important implications for short-term traders in derivatives and esoterics to note (yet always remembering Gauss, potential exogenous variable impacts to forecast model projection outcomes, and the requirements of effective stop protection science and applications for sequentially successful scenario setup opportunity yields and overall continued alpha string optimization).
As we look evermore closely at each our additional key cyclical periodicities, we can also cautiously mitigate, recognizing relative down-pressure does not completely 'come off the tape' until passing through several 'key cycle periodicities' EBW intraweek Wednesday/Thursday lows. We find this in some degree in the AEV EBW, the 2QEV EBW, the 2MEV EBW, the MEV EBW, and even manifested in 'undercurrent' in the bullish WEV EBW that we just experienced, intraday, within this past week's FRB Chair FedSpeak-led rally. And this Monday's rally 'cooling' pause on the heels of Fed Chairman Powell's relatively hawkish speech at NABE fits congruently within this particular cyclical bias and observation.
To be on the safe side, within our KEY ACTIVE ADVANCED MANAGEMENT HIGH ALPHA STRING ENHANCING CAPITAL GAIN CAPTURE PROTECTVEST AND ADVANCEVEST APPLICATIONS, we will set, and apply, each of our cyclically included coordinate forecast echovector projection (CFEV - spaced and dotted) OTAPS action vectors, and their targeted execution ladder steps, accordingly, for high alpha gain capital gain capture optimization, and for alpha sting enhancement... and let the real-time market print washes through our active advanced position and risk management setup in the coming week, as we pursue and net our advanced scenario setup and active advanced position and risk management gains from our historical data intensive and data coordinated ascertainments and preparations.
Interestingly, if we zoom out further yet, to include the 2-year Congressional cycle, we once again find interesting cyclical support in the week following each of these key monthly option expirations (MJSD - March, June, September, December), and their 'prior weeks' Wednesdays.
FRAMECHART BY MDPP PRECISION PIVOTS GLOBAL FINANCIAL MARKETS LABORATORY
These are powerful forecast projection bias implication and position management setups, within the criterion of continuance, regarding momentum and cyclical history price action, for intermediate term position management, and especially for shorter-term traders in derivatives and esoterics.
As mentioned earlier this week, we are inclined to be very observant of market price dynamics this week and into next, as we consider SPY ETF hedge insurance applications and techniques. In this regard, we remain incline to consider utilizing and placing "dynamic, active, and adjustable straddling positions in order to lock in gains and to better manage exposure to general market price level changes in either direction. Setting advanced management straddles at key coordinate forecast levels is a very effective and opportune approach, and an advanced position management and trading strategy. Using this approach at this time could prove very valuable in effectively managing both market risk and reward ahead. My general bias remains cautious. "Don't Fight The Fed" remains in force, and if the Fed begins the process of a relative de-leveraging of the markets compared to what it has been doing, it must proceed very smoothly, and very cautiously about what it takes away, and when and how. And we want to remain well prepared for any market reactions.
We will continue to closely watch the 2-year Congressional cycle echovector, the Annual cycle echovector, and each of the inclusive and key subsumptive cycle echovectors (Bi-Quarterly, Quarterly, Bi-monthly, Monthly, Weekly, etc.), for continued symmetries and confirming parallels and early divergent tells, and try to report them. And we will plan to keep calculating our echovector pivot points and employing our dynamic OTAPS On-Off-Through Vector Target Application Price Switch triggers as well.
Again, we hope you find today's valuable cyclical technical analysis based market intelligence update interesting, and its provided observations useful forward.
Thank you.
TO ENLARGE AND FURTHER ZOOM 'TODAY'S TOMORROW TRADER'S EDGE' PIVOT POINT INDICATOR FOCUS FORECAST FRAMECHART SNAPSHOTS
(1) RIGHT CLICK ON THE PROVIDED SNAPSHOT AND 'OPEN IMAGE IN NEW TAB, AND THEN LEFT CLICK ON THE PLUS MAGNIFIER, OR
(2) LEFT CLICK ON THE PROVIDED SNAPSHOT LINK, THEN LEFT CLICK ON THE SNAPSHOT TO ENLARGE, THEN RIGHT CLICK TO FIND 'OPEN IMAGE IN NEW TAB' AND LEFT CLICK, THEN LEFT CLICK THE ZOOM MAGNIFIER.
FRAMECHART BY MDPP PRECISION PIVOTS GLOBAL FINANCIAL MARKETS LABORATORY
DISCLAIMER: This article is for educational and informational purposes only. There can be significant risks involved with investing including loss of principal. There is no guarantee that the goals or the strategies and examples discussed will be achieved. NO content published by us on the Site, our Blogs, Newsletters, and any Social Media we engage in constitutes a recommendation that any particular investment strategy, security, portfolio of securities, or transaction is suitable for any specific person. Further understand that none of our bloggers, information providers, App providers, or their affiliates are advising you personally concerning the nature, potential, value or suitability of any particular security, portfolio of securities, transaction, investment strategy or other matter. Again, this post is for educational and informational purposes only. BEFORE MAKING ANY INVESTMENT DECISIONS WE STRONGLY ENCOURAGE YOU TO FIRST CONSULT WITH YOUR PERSONAL FINANCIAL ADVISOR.
----------------------------------------------------------------------------------------------------------------------------
ADDENDUM 1: MODEL NOMENCLATURE AND METHODOLOGY NOTES
PIVOT POINT CALCULATION AND CONSTRUCTION SESSION
ILLUSTRATING THE TIME CYCLE PIVOT POINT INDICATORS AND THEIR KEY SREV CFEV 'S AND R' SUPPORT/RESISTANCE PIVOT POINT PRICE PROJECTION VECTORS
S&P500 SPY ETF PIVOT POINTS INDICATOR - ANNUAL AND SUBSUMPTIVE TIME CYCLE PIVOT POINTS IMPLICATIONS (EG., QUARTERLY, MONTHLY, ETC.) AND THEIR ASSOCIATED ECHOBACKPERIODS AND COORDINATE FORECAST SUPPORT AND RESISTANCE VECTORS (CFEVs, SREVs) HIGHLIGHTED AND ILLUSTRATED - DAILY CANDLES
PRESENTED BY THE PRECISION PIVOTS GLOBAL FINANCIAL MARKETS LABORATORY!
================================================
ADDENDUM 2: MODEL NOMENCLATURE AND METHODOLOGY NOTES
ECHOVECTOR TECHNICAL ANALYSIS ASSOCIATION - EVTAA.COM
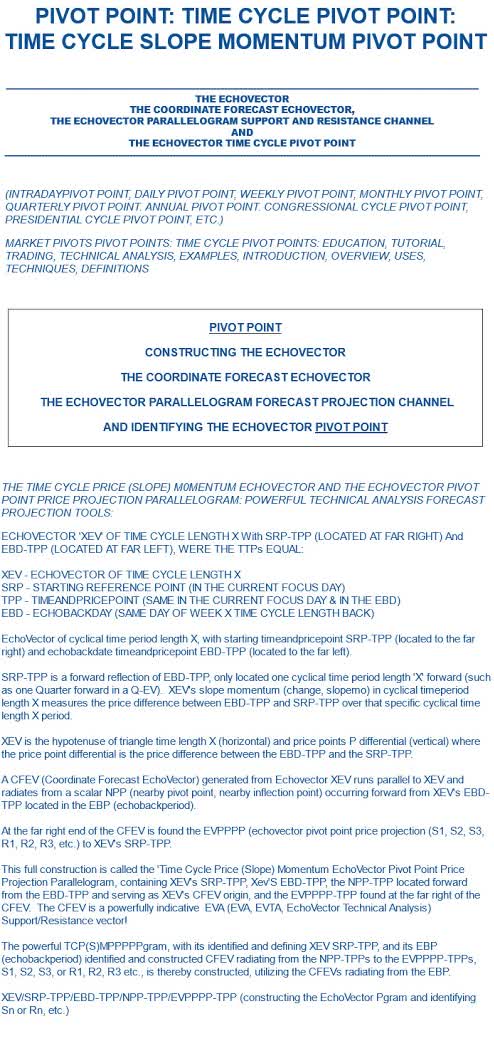
THE TIME CYCLE PRICE (SLOPE) MOMENTUM ECHOVECTOR AND ECHOVECTOR PIVOT POINT PRICE PROJECTION PARALLELOGRAM:
POWERFUL TECHNICAL ANALYSIS FORECAST PROJECTION TOOLS:
ECHOVECTOR XEV OF TIME CYCLE LENGTH X With SRP-TPP (LOCATED ON FAR RIGHT) And EBD-TPP (LOCATED ON FAR FAR LEFT).
XEV - ECHOVECTOR OF TIME CYCLE LENGTH X
SRP - STARTING REFERENCE POINT (IN CURRENT FOCUS DAY)
TPP - TIMEANDPRICEPOINT (IN CURRENT FOCUS DAY & EBD)
EBD - ECHOBACKDATE (SAME DAY OF WEEK, X TIME CYCLE LENGTH BACK)
EchoVector of cyclical time period length X, with starting timeandpricepoint SRP-TPP (to the far right) and echobackdate timeandpricepoint EBD-TPP (to the far left).
SRP-TPP is a forward reflection of EBD-TPP, only located one cyclical time period length 'X' forward (such as one Quarter forward in a Q-EV). XEV's slope momentum (change, slopemo) in cyclical time period length X measures the price difference between EBD-TPP and SRP-TPP over that specific cyclical time length X period.
XEV is the hypotenuse of triangle time length X (horizontal) and price points P differential (vertical) where the price point differential is the price difference between the EBD-TPP and the SRP-TPP.
A CFEV (Coordinate Forecast EchoVector) generated from EchoVector XEV runs parallel to XEV and radiates from a scalar NPP (nearby pivot point, nearby inflection point) occurring forward from XEV's EBD-TPP located in the EBP (echobackperiod).
At the far right end of the CFEV is found the EVPPPP (EchoVector Pivot Point Price Projection (S1, S2, S3, S4, R1, R2, R3, R4, etc.) to XEV's SRP-TPP.
This full construction is called the 'Time Cycle Price (Slope) Momentum EchoVector Pivot Point Price Projection Parallelogram, containing XEV's SRP-TPP, Xev'S EBD-TPP, the NPP-TPP located forward from the EBD-TPP and serving as XEV's CFEV origin, and the EVPPPP-TPP found at the far right of the CFEV.
The CFEV is a powerfully indicative EVA Support/Resistance vector! The powerful TCPSMPPPPPgram, with its identified and defining XEV SRP-TPP, and its EBP (echobackperiod) identified and constructed CFEV, radiating from the NPP-TPPs to the EVPPPP-TPPs, (S1, S2, S3, S4, R1, R2, R3, R4, etc.), is thereby constructed.
XEV SRP-TPP/EBD-TPP/NPP-TPP/EVPPPP-TPP (Sn Or Rn)
----------------------------------------------------------------------------------------
*AGAIN THIS
POST MAY INCLUDE POST MASTERS AND POST DOCTORAL LEVEL EDUCATIONAL AND
DISSERTATIVE INFORMATION, AND PROFESSORIAL TUTORIAL CONTEXTING AND
REFERENCING, WITHIN THE TECHNICAL FIELDS OF MARKET BEHAVIORAL ECONOMICS,
FINANCIAL MARKET PIVOTS TECHNICAL ANALYSIS, AND ADVANCED FINANCIAL
PHYSICS, DISSEMITATIVELY.
POSTING UPDATES ALSO FROM - MARKETPIVOTSTV SP500TV AND OPTIONPIVOTSLIVE (OPL)


PROVIDING PORTIONS OF THIS WEEK'S KEY POWERFUL FORWARD
EVTAA
EDUCATIONAL MARKET CONTEXTING
AND ILLUSTRATIVE SCENARIO SETUP OPPORTUNITY INDICATING
VISUAL TIME CYCLE INTENSIVE TECHNICAL ANALYSIS FRAMING...
POWERFUL EVTAA CONTEXTING - TUTORIAL FORECAST PROJECTION SCIENCE AND ACTIVE ADVANCE POSITION AN RISK MANAGEMENT MARKET INTELLIGENCE
NOW PROVIDED FREE ONLINE!

----------------------------------------------------------------------------------------------------------------------------------------
THANKING THIS MONTH'S APPRECIATED SPONSOR
POWERTRADESTATONS AND POWERTRADESTATIONSGLOBAL

BE SURE LOOK FOR THE POWERTRADESTATION IMPRIMATUR ON EACH TRADING COMPUTER LISTING TO MAKE SURE YOU ARE PURCHASING A GENUINE POWERTRADESTATION!
"We Put Our Traders And Their Success First!"
POWERTRADESTATONS AND POWERTRADESTATIONSGLOBAL
"Experienced traders & trader technicians working with traders for traders to help enable traders & investors to make better trades!"
Striving to Provide Both Excellence & Economy In Proven Extended Market Visibility Supporting Financial Tradestations, To Help Our Traders Advance!"
Optimizing Intelligence, Performance And Price For Our Traders Globally!
__________________________________________________________
SEE PRIOR POSTS FOR ADDITIONAL CONTEXT, STUDY AND REVIEW __________________________________________________________
