And last year's well-forecasted time cycle price momentum echovector pivot point analysis market movements have proven powerfully efficacious and opportune for any practicing active advanced position and risk management methodologist who has followed this work and incorporated it in their analytic approach within their overall forecast, timing, and position management matrix.
Last year I warned for protection on the July highs, noting little advantage in holding long going into a forecasted fall melt (and suggested being ready to be reverse to capture positive associated extension on the short side). I also warned that this melt would be met by a bounce to further highs into winter and spring this year, viewing this last bounce as the end game (and the last intermediately significant majority payoff within the 8-year echovector regime change cycle, the 4-year echovector presidential cycle, with likely little but possible upside extended cone 'topping' left remaining on the 16-year echovector maturity cycle.
Last year's powerfully effective technical forecast, presenting these well-framed and mentioned market price dynamics, were presented as early as last March. See Benzinga article titled, "The American Political Economic Cycle And The Current Melt-Up in Stocks: A Powerfully Revealing EchoVector Analysis of the Current 5-Year Bull Market In Stocks And An Update Of The Article 'Don't Fight The Fed'. " The following framechart and exposition is a key excerpt from this article, and highlights great insight into last year's powerful forecast and its subsequent effective position management and strategy guidance through the remainder of the year:
"A LOOK AT THE LAST THREE US PRESIDENTIAL ADMINISTRATIONS' POST MIDTERM ELECTION MELT-UPS IN STOCKS
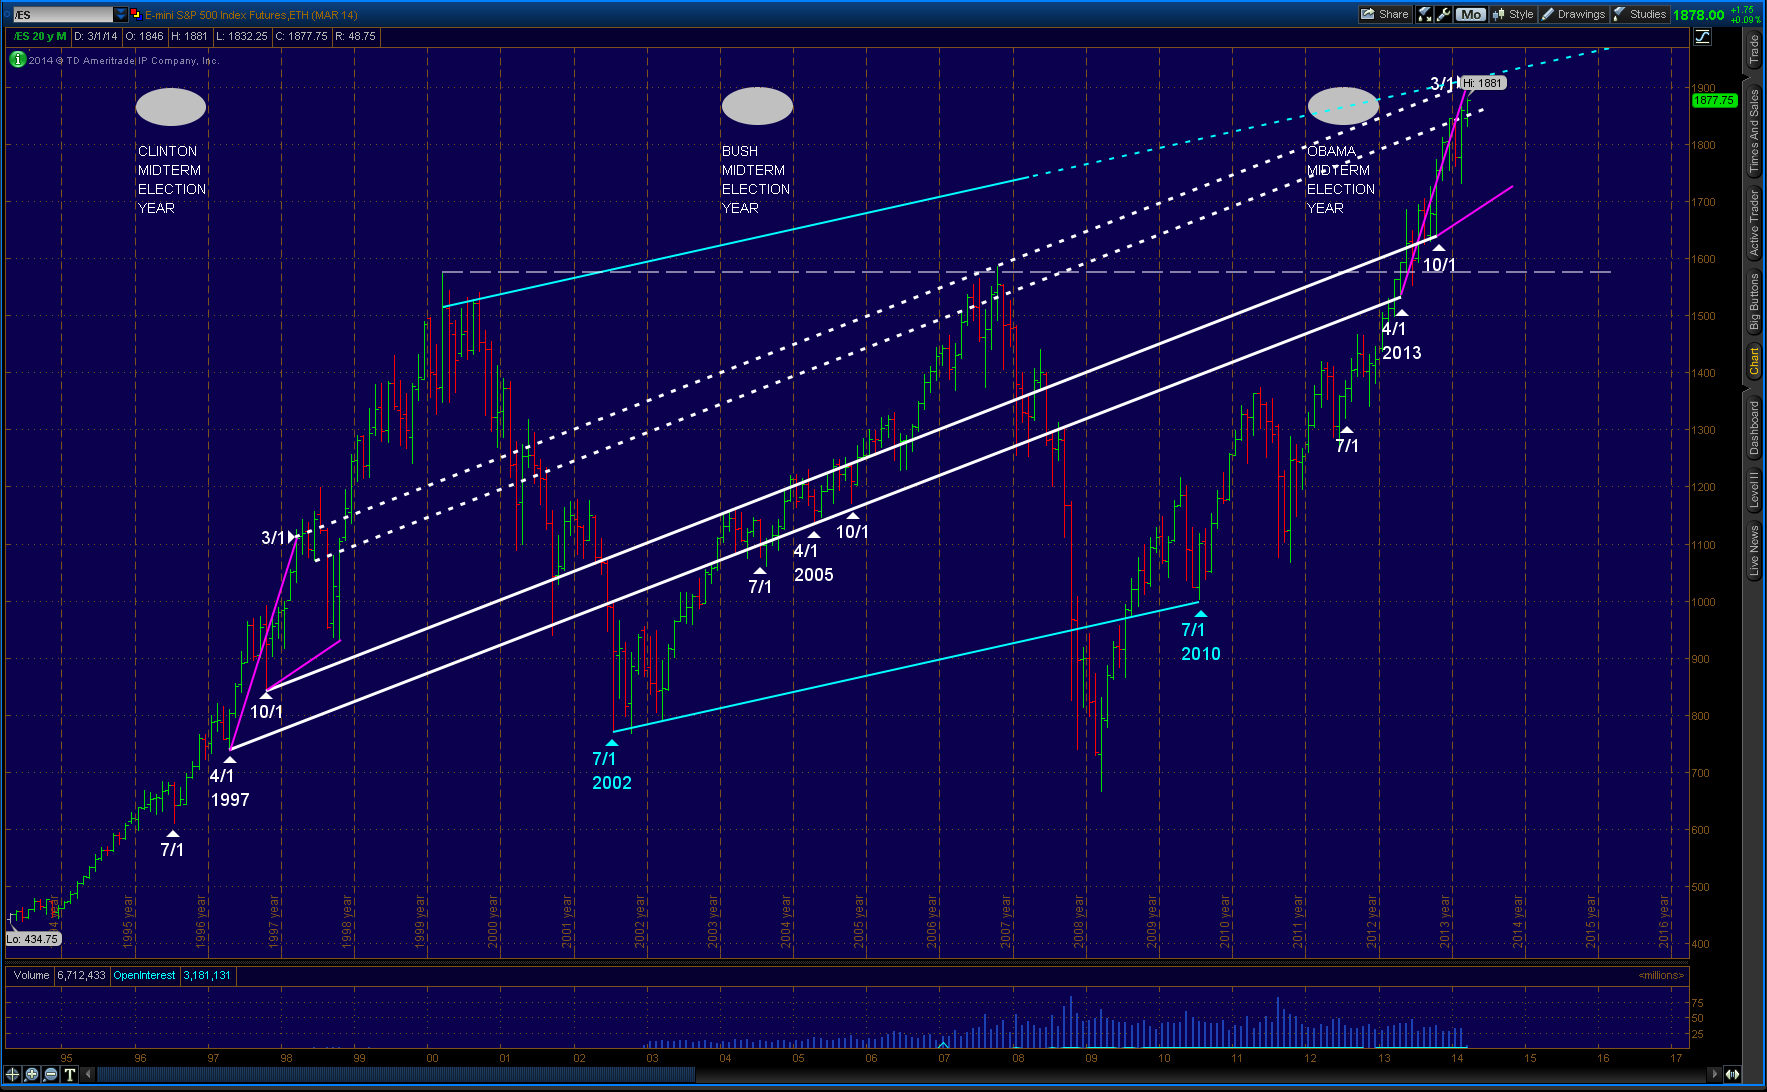
Let's begin by looking at the following 20-year price track of the S&P 500 Composite Stock Index as reflected a proxy chart of the popular /ES E-mini Futures on that index.
S&P 500 Stock Composite Index /ES E-mini Futures 20-Year Monthly OHLC Perspective
(click to enlarge)
http://www.benzinga.com/files/u79280/benzinga_kw_20y_es.png
"In the chart above note the key white 16-year market financial cycle echovector running from The April 1, 1997, the echobackdate and year following the Clinton Administration mid-term election year, to the April 1 2005 echobackdate and year following the Bush Administration mid-term election year, to the April 1 2013 echovector start date, and year following the Obama Administration mid-term election year.
Notice also the general horizontal price resistance level highlighted in white running from the Clinton Regime's price level toppiness in year 2000 to the Bush Regime price level toppiness in year 2007 to the late spring and summer time sell in May and go away period of the Obama Regime in 2013.
In May of 2013 prices had faltered at this critical time and price level and fell nearly 10% into June. Rallying off the June lows prices began to fall back again in August, potentially setting up a toppy formation much like that in 2007.
It was in the Federal Reserve Bank's genuine interest, and in The Federal Reserve Bank Chairman's focus, his specialty, and his legacy interest, to prevent another market collapse reminiscent of 2008 or 2001-2002, and this seasonal price pressure weakness from accelerating into a more precarious market price phenomena and political economic market cycle echo. And the central bank's ensuing coordinated efforts to place a bridge under stock market prices that summer could not have been more effective nor better timed for this purpose.
The bridge in place, and holding well into November, and that month's returning annual and congressional cycle lows kicking in, with them occurring at these upper and bridged supported price levels, set the stage for significantly better price level momentum trajectory than otherwise, and eventual price level resistance breakthrough and price melt-up, in lieu of price level collapse. Whereas these last three regime mid-term election years appear characterized by little price progress going into July after their first quarter highs, the year that follows, being year 5 in the existing administration's regime change cycle, holds onto momentum price gains on both a year-over-year basis and on a 2-year congressional cycle basis. The latter being even stronger, accelerating prices even further and propelling them into melt-up. This effect was anticipated in my article of August 2012, and has been central to my positive market forecast since."
THIS YEAR, THIS MONTH, THIS WEEK...
This year's shorter term perspective echovector analysis forecasting, using the key active and subsumptive congressional cycle echovectors (CCEVs), annual cycle echovectors (AEVs), bi-quarterly cycle echovectors (2QEVs), quarterly cycle echovectors (QEVs), Monthly cycle echovectors (MEVs) biweekly cycle echovectors (2WEVs) weekly cycle echovectors (WEVs), and the one and two day cycle echovectors, and their coordinate subsumptions and convergences, and their subsequent aggregated price pressure magnitude and directional key inflection points, have proven again to be very price motion dynamics and forecast effective, and powerfully position opportunity and capital gain capturing generative, and further highly productive in their contributions to active advanced pivot point forecasting and risk management , occurring within the MDPP Forecast Model and Alert Paradigm and the ProtectVest and AdvanceVest Active Advanced Position and Risk Management Regime. As forecast in these perspectives and scopes, prices have moved little since last year's end year high close to 2100 on the SPX, and the market has moved quite orderly and forecastibly within an informed and attendant trader's dream.
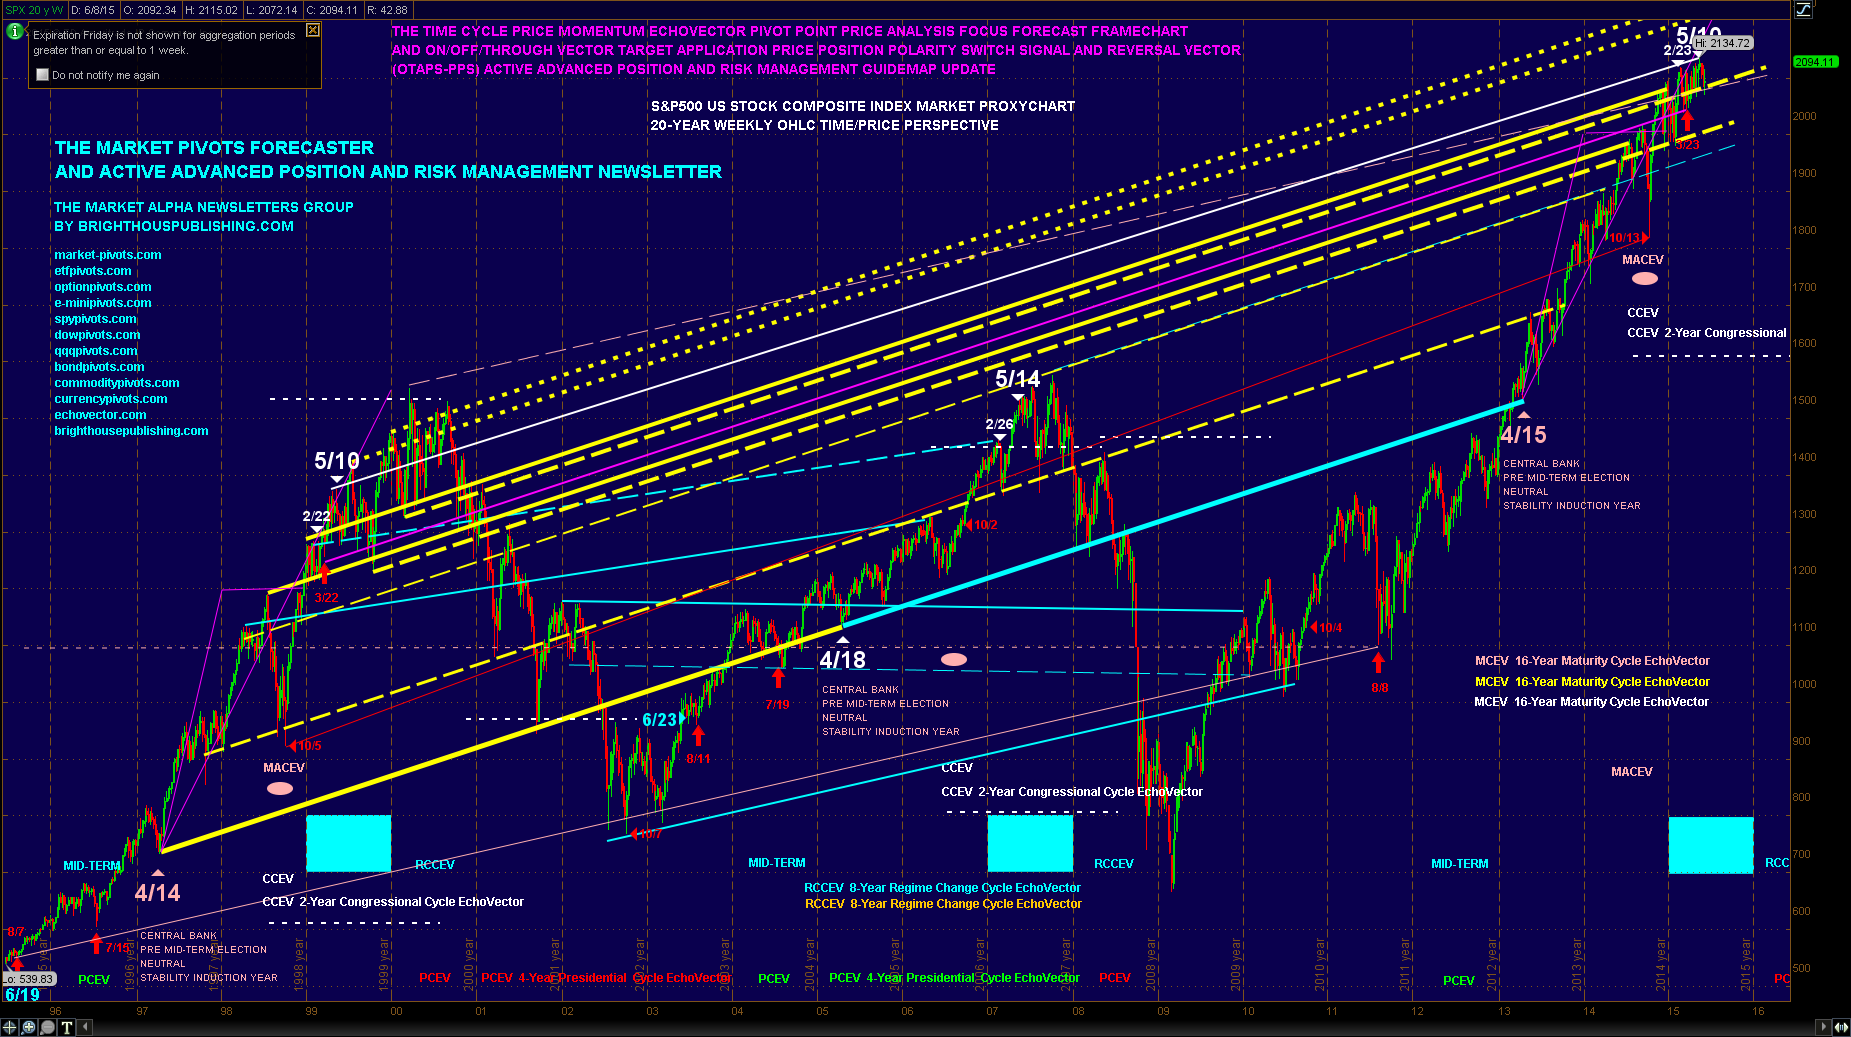
See "THE MARKET PIVOTS FORECASTER AND ACTIVE ADVANCED POSITION AND RISK MANAGEMENT NEWSLETTER, FREE ONLINE VERSION," for current and ongoing updates on these shorter-term forecast scopes, perspectives, and opportunity and strategy setups, framecharts, and active advanced position management guidemaps, all presented in virtual and tutorial formats online free. However, this next month, and its key time cycle price momentum echovector inflection point clusters and subsequent potential forecast echovector rotation measurements are too important to fail to bring to additional traders' and researchers' attentions, and to fail to highlight across the Market-Pivots.com and The Market Alpha Newsletters Group communities, and associated market and research information distribution channels. See the echovector analysis framechart below.
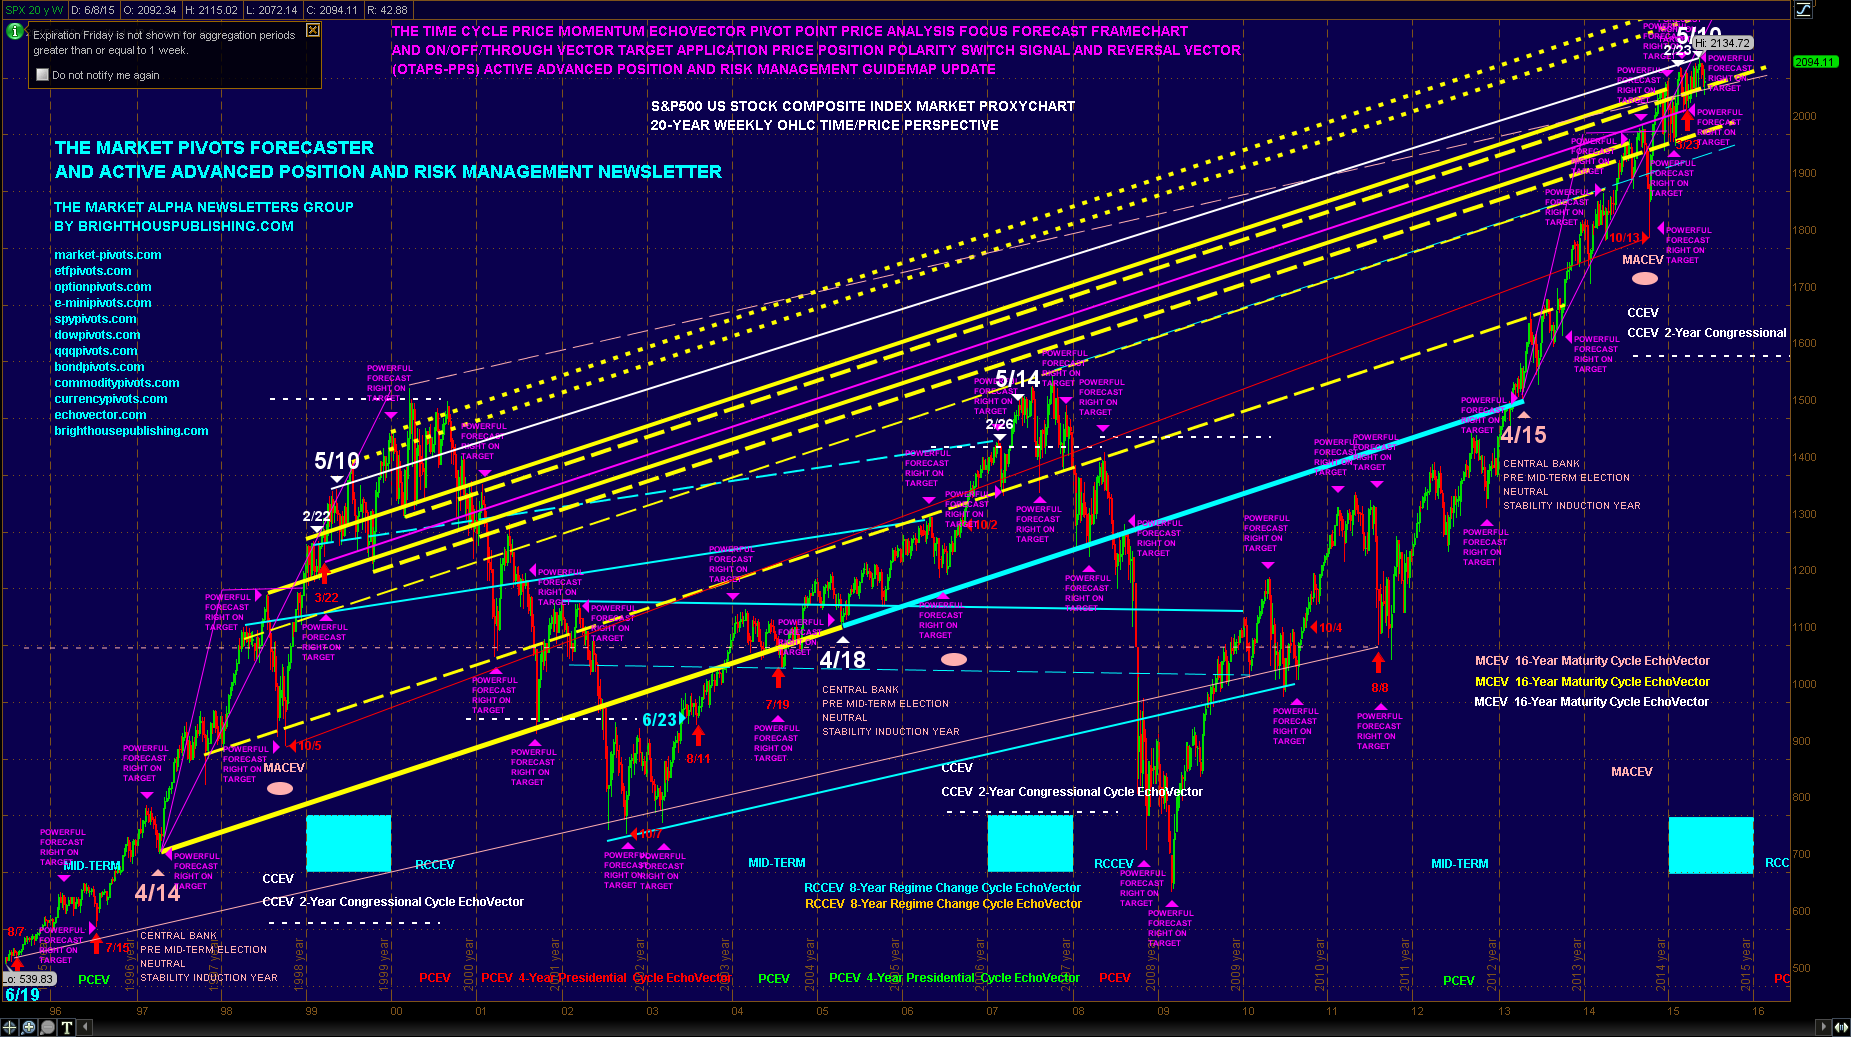
SATURDAY 13 JUNE 2015 UPDATE: POWERFUL FORECAST RIGHT ON TARGET: SPYPIVOTS.COM ECHOVECTOR FOCUS FRAMECHART (ZOOMED) SPX US COMPOSITE MARKET SECTOR PROXY SPX S&P 500 US LARGE CAP STOCK COMPOSITE INDEX PROXYCHART TIME CYCLE PRICE MOMENTUM ECHOVECTOR PIVOT POINT PRICE PROJECTION AND ANALYSIS FRAMECHARTS: KEY ACTIVE MCEV, RCCEV, PCEV, AND CCEV AND RELATED EBDs AND KEY NPPVs AND OTAPS-PPSSVs (CONSTRUCTION 1) HIGHLIGHTED AND ILLUSTRATED SPX ECHOVECTOR PIVOT POINT ANLYSIS FOCUS FORECAST FRAMECHART 20-YEAR OHLC TIME/PRICE PERSPECTIVE (RIGHT CLICK ON FRAMECHART TO OPEN IN NEW TAB, THEN LEFT CLICK ON FRAMECHART TO FURTHER ENLARGE)
EchoVector Analysis Focus Forecast FrameChart
SPX S&P 500 US STICK COMPOSITE INDEX PROXYCHART
TIME CYCLE PRICE MOMENTUM ECHOVECTOR PIVOT POINT PRICE PROJECTION AND ANALYSIS FrameChart
KEY ACTIVE MCEV, RCCEV, PCEV, AND CCEV
AND RELATED EBDs AND KEY NPPVs
AND OTAPS-PPSSVs (CONSTRUCTION 1)
HIGHLIGHTED AND ILLUSTRATED
SPX FOCUS FORECAST FRAMECHART
20-YEAR OHLC TIME/PRICE PERSPECTIVE
(CLICK ON FRAMECHART LINK AND OPEN IN NEW TAB TO FURTHER ENLARGE)
As can be seen highlighted and illustrated on the 20-year SPX EchoVector Analysis focus forecast framechart provided above, significant cyclical pressure comes into phase on the echovector maturity cycle, the echovector regime change cycle and the echovector presidential cycle into June and July. Couple this with the FRB's key meeting this coming week regarding interest rates, and the admixture appears compelling for significant OTAPS-PPS lead position management and nimbleness to be firmly in effect and followed. We presently believe the potential downside into fall moving into July from this point in time may be significant, and therefore remain long-term short below our key active SPX OTAPS-PPS at 2134.50, and long-term long again above that level. And in the intermediate and short-term we presently remain right on target, according to our shorter term CCEV (and its subsumptive shorter time cycle price momentum echovectors coordinate and their phase intersects and price pressure aggregates relative to key price motion pivot points and derived price inflection points.
For those unfamiliar with active advanced position management, we strongly suggest considering the following course of action highlighted from the "Market Pivots Forecaster" newsletter within the Market Alpha Newsletters Group by this author and analyst:
"... This phase of the 16, year echovector maturity cycle, the 8-year echovector regime change cycle, and the 4-year echovector presidential cycle, does not necessarily bode well for the US stock market from levels established in mid-May 2015, and going forward into this summer, from an advanced risk management point of view. A good chart of the SPX illustrating this phenomena the last 20 years can be viewed at my SeekingAlpha posts by clicking here. For this reason my general bias currently remains primarily cautious, with ProtectVEST orientation management now in effect.
We have had a great run since the lows I forecasted to the day in March 2009. My subsequent and equally timely longer-term forecast presented in "Don't Fight The Fed", as delineated in this August 2012 globally distributed article, remains in force. And if the Fed does begin the process of de-leveraging of the markets this season with an upward change in its prime lending rate (compared to what it has been doing) it must proceed very smoothly, and very cautiously... regarding what stimulus it takes away, and when, and how, and to what extent. And I would not want to be on the wrong side of poor market reaction that may result as the FRB begins this process.
For this reason, I think it prudent to continue to use and place dynamic, active, and adjustable straddling positions in order to lock in gains and to better manage your exposure to general market price level changes in either direction. Setting advanced management straddles at key coordinate forecast levels is a very effective and opportune approach, and an advanced trade strategy.
In this article I have provided an EchoVector Pivot Points Perspective and method for effectively determining trigger level prices, settings, and adjustments. Using this approach at this time could prove very valuable in effectively managing both market risk and reward. One way to employ such a straddle would be to utilize the SPY ETF correlated to the SPX mentioned earlier in this analysis, or by using the approach illustrated with the /ES SP500 Stock Composite Index E-mini Futures, by setting up an advanced trade technology approach (see "On-Off-Through Vector Target Price Switch") to positioning and position management, with appropriate dynamic triggers and stops included -- for example, at $213.75 on the SPY.
To perform the short side of the straddle, set a short trigger below $213.75 on the SPY pre-programmed as a "repeating short trigger switch" at this trigger level on reverse downtick action through the trigger price, with stops set to activate on reverse uptick up-through action. To perform the long side of the straddle, set a long trigger above $213.75 pre-programmed as a "repeating long trigger switch" on reverse uptick action through the trigger, with stops set to activate on reverse downtick down-through action. I would continue to closely watch the 4-year presidential cycle echovector, the 2-year congressional cycle echovector, and the annual cycle echovector for continued symmetries and confirming parallels and early divergent tells. And I would keep calculating my echovector pivot points and employing my dynamic OTAPS On-Off-Through Vector Target Price Switch triggers. This way you won't be fighting the Fed; and will in fact be letting the Fed, and the market, help point you in the direction you 'should be facing.' If a correction is coming, you will be ready. And if it isn't, you will be ready for that as well."
This is ProtectVEST and AdvanceVEST active advanced position and risk management at work for you! Secured against a market value level fall, yet ready to advance if the market moves forward! And learn about and become familiar with our even more advanced and profitable position polarity switching and double-double leverage optimization methodology!
"Positioning for change, saying ahead of the curve, we're keeping watch for you!"
ProtectVEST and AdvanceVEST By MDPP PRECISION PIVOTS