


Disclosure: I have no positions in any stocks mentioned, and no plans to initiate any positions within the next 72 hours.
This past February, following gold's second leg down from
the relatively lofty price levels it enjoyed in November 2012 (and after
falling 15% lower), many analyst were suggesting the time had become
ripe to re-enter gold. I was concerned that too many were ignoring
gold's seasonal trading pattern, so I published an article titled "Gold Chart: Price May Be Right, But Is Timing?". In this article I presented the chart below, highlighting gold's relative weakness from March through June the past four years, and I suggested that on a risk-reward basis this price history might not favor a February re-entry. This article was written on February 26th and published on SA the next day. I also suggested then that waiting until summer for re-entry seemed a more prudent strategy. Here is a copy of the chart I presented.
GLD ETF: 4-YEAR DAILY OHLC
(Click on chart to enlarge and continue to click to further zoom)

Along with the chart, I stated,
"... regardless of whether or not the GLD $150 area provides support this year (it has since the end of 2011), I would tend to be cautious of a potential second wave of price weakness coming this year as we enter into May. Gold now appears to be fundamentally and cyclically primed to search again then for first half year momentum lows. Longer term risk-on positioning between now and then may have few rewards.Well, since February the wisdom behind this perspective has borne out quite well. And we find now, having finished May's third Saturday options expiration, that gold is down nearly another 20% from my article's publication and warning based on GTU ETF prices. 20% is a pretty penny saved (or even better, a pretty penny earned if you also took advantage of the short side, which I recommended in other works (see SeekingAlpha Instablog "Key Focus Interest Period On The Gold Metals: A GLD ETF Perspective: Charts" and GOLDPIVOTS "GLD ETF Pivot Alert: Short-Term Downside Bias".
Last year is a good case in point. Between the beginning February 2012 and the beginning of May 2012, GLD lost about 10 points. Then from the beginning of May 2012 to the end of May 2012, GLD lost about another 10 points in a significant second price wave downward before heading sideways, and building up a genuine and corrective pre-launch stage for a significant price pivot and rally into fall.
Whether from lower lows, or from higher lows, I presently prefer to wait for this seasonal price down-pressure to clear before becoming potentially enthusiastic about a long position in gold going into the second half 2013. Waiting until about the beginning of July has been a very good annual risk-on and risk-management strategy for gold since July 2009."
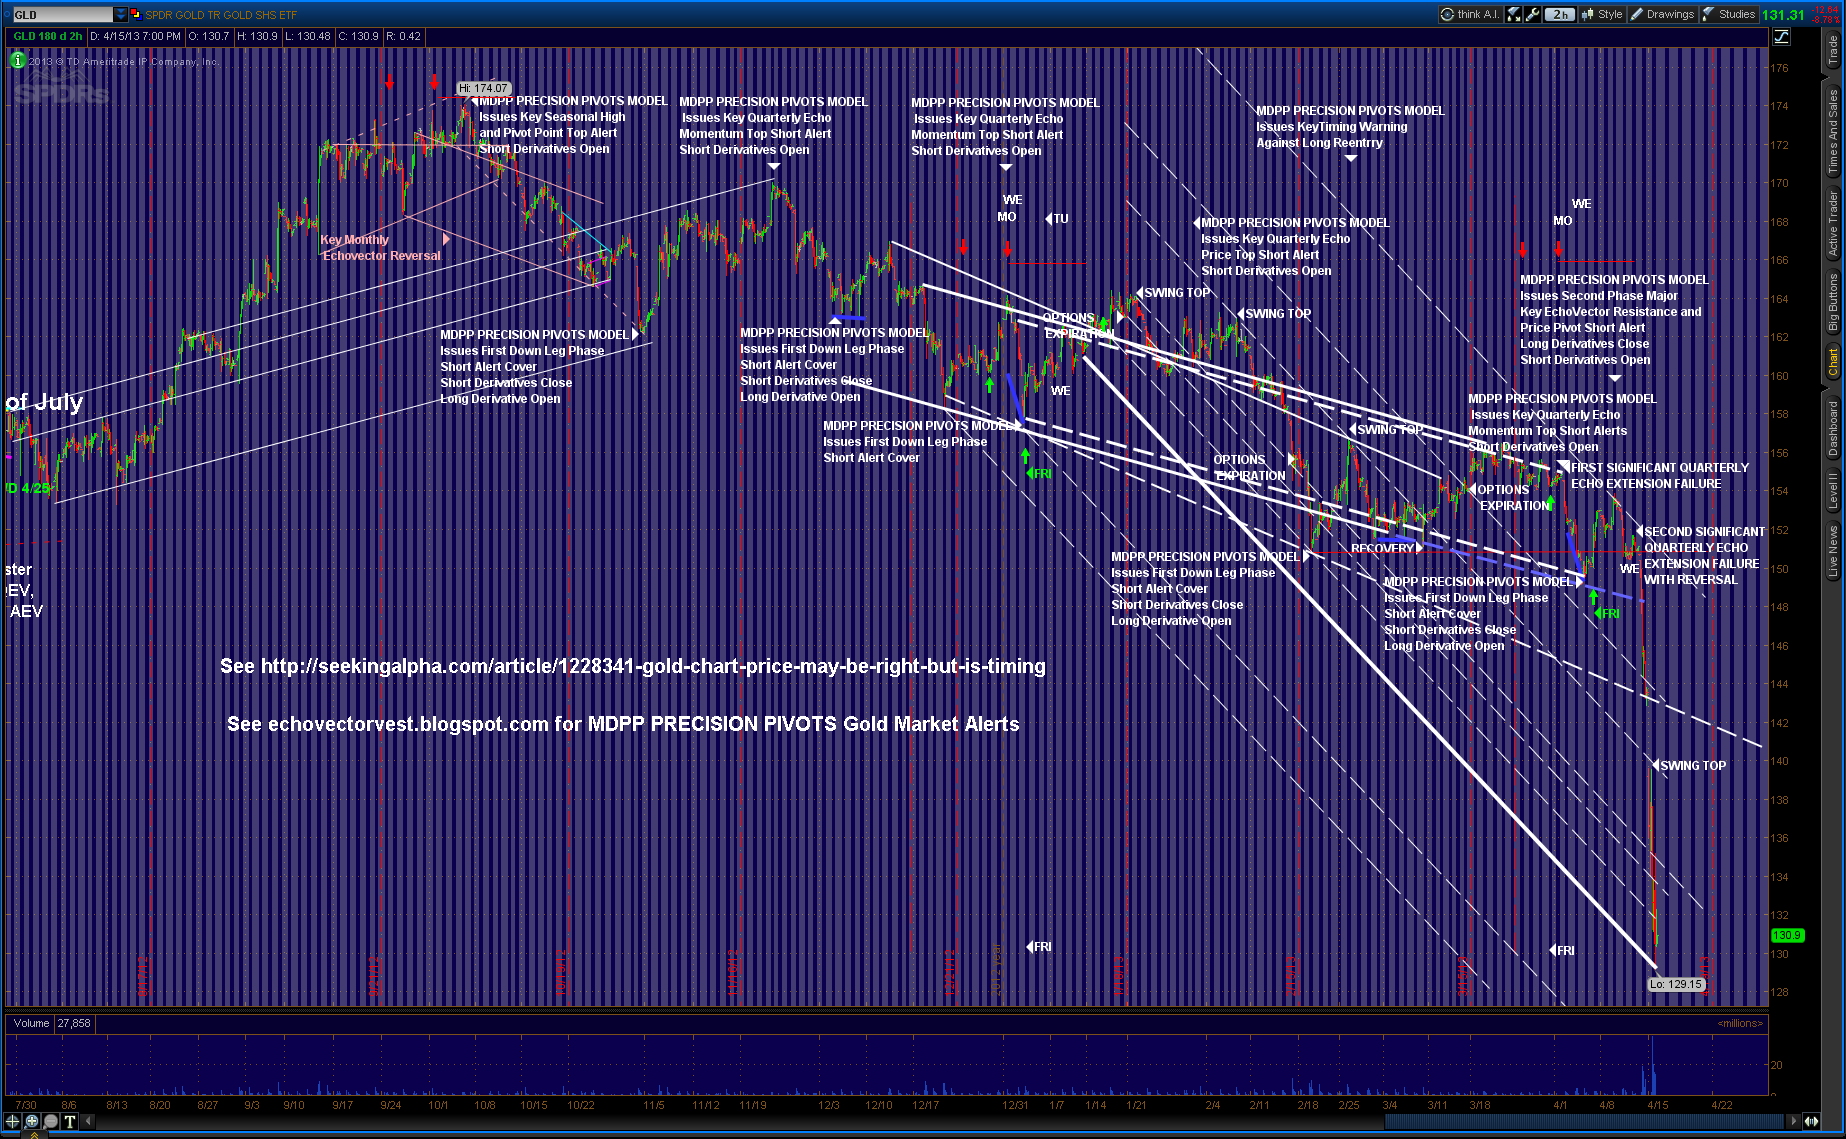
Below are two gold chart perspectives of the GLD ETF which also include my alerts leading into February, and perhaps the most interesting part of the period afterward:
GLD ETF 200-DAY 2-HOUR OHLC
(Click on chart to enlarge and continue to click to further zoom)
GLD ETF 100-DAY HOURLY OHLC
(Click on chart to enlarge and continue to click to further zoom)
Since these charts were first published April 16th, we have again-- as of this Friday-- revisited its lows.
So, where do we stand with gold? The short answer is $131 on the GLD. But with conversions from gold bulls to gold bears that seems multitudinous.
A vocal chorus of gold analyst are even proclaiming that the gold bull is history.
Some are saying that investors are re-discovering both U.S. equities and the U.S. dollar (perhaps to buy the equities). Others claim that gold is being undone by general commodity price woes, and/or by growing investor concerns regarding confidence in gold ETF underlying 'paper assets.' Some are even claiming gold is succumbing this quarter to a disturbing and seemingly difficult for them to understand 'technical analysis oriented rupture.'
On the other side of this vocal gold discussion is the ready two-pronged argument from the "Government is less than competent and gold is safe" group. Their mantra, that gold will either 'rally from Uncle-induced monetary hyperinflation' or rally from Uncle-induced monetary collapse,' or rally from both, is being presented as fervently as ever. Some gold bulls are even suggesting that a severe enough gold collapse may induce another leverage-based crisis and contagion in the general markets, which will duress the system to the point of gold again becoming safe-haven centric and rallying back strongly.
I'm sure most ardent readers have heard these many buy-side and sell-side arguments, and more, recently with the broad spectrum of commentators on the gold market, and probably many times over. (I mention none of these arguments with disrespect, either. Historically the gold market has had a way of making gold bulls and gold bears as humble as it deems fit, regardless of postulations and reasonings... so I consider another's perspective with great respect, regardless of lean.)
However, stepping back from these often fascinating media saturating discussions, I prefer to look closely (once again) at the charts, and any patterns they might reveal, for possible 'staging clues' regarding gold's potential trajectory or 'pivoting' in the coming weeks, and possibly in the coming months.
Having updated my review, this is what I now find affecting my perspective, and where I find it. Looking at...
THE /GC GOLD FUTURES OHLC
(Click on chart to enlarge and continue to click to further zoom)
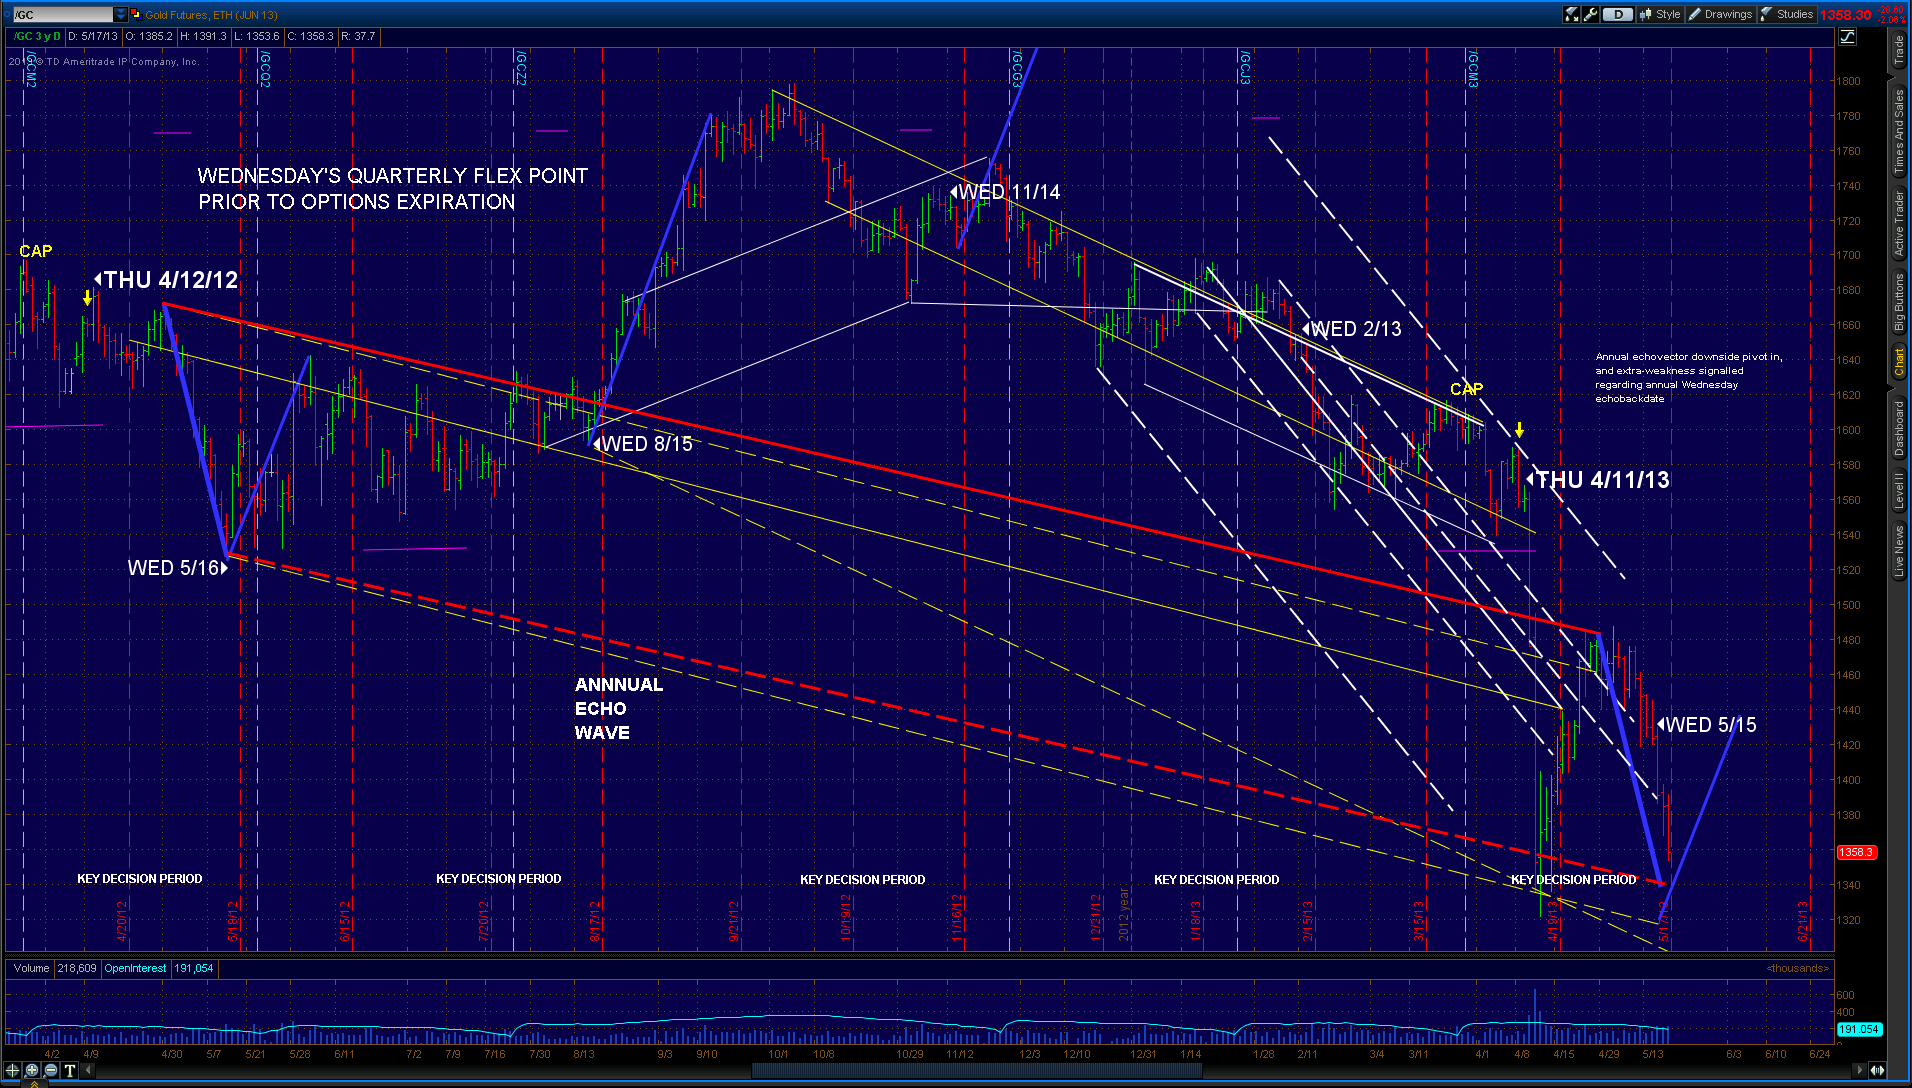
On an annual cycle basis, to me /GC is indicating we may be getting ever closer to the start of significant seasonal support on a timing basis. The middle of May through the end of July was compression area last year. The triangle patterns indicate a nice battle between supply and demand last June and July. In the end, the seasonal pattern won, and we 'echoed-out' into a bull rally just as we did the previous year. This end-summer and early-fall rally ran right up into October, with a nice 13% gain. This year the question is whether or not the bulls are again up to the fight at current levels during this key summer compression period. My suggestion is to remember the old Wall Street adage, "Don't try to catch a falling knife," and let the bulls prove themselves for a while before considering a serious jump back into gold. Significant short-covering alone might not signal enough.
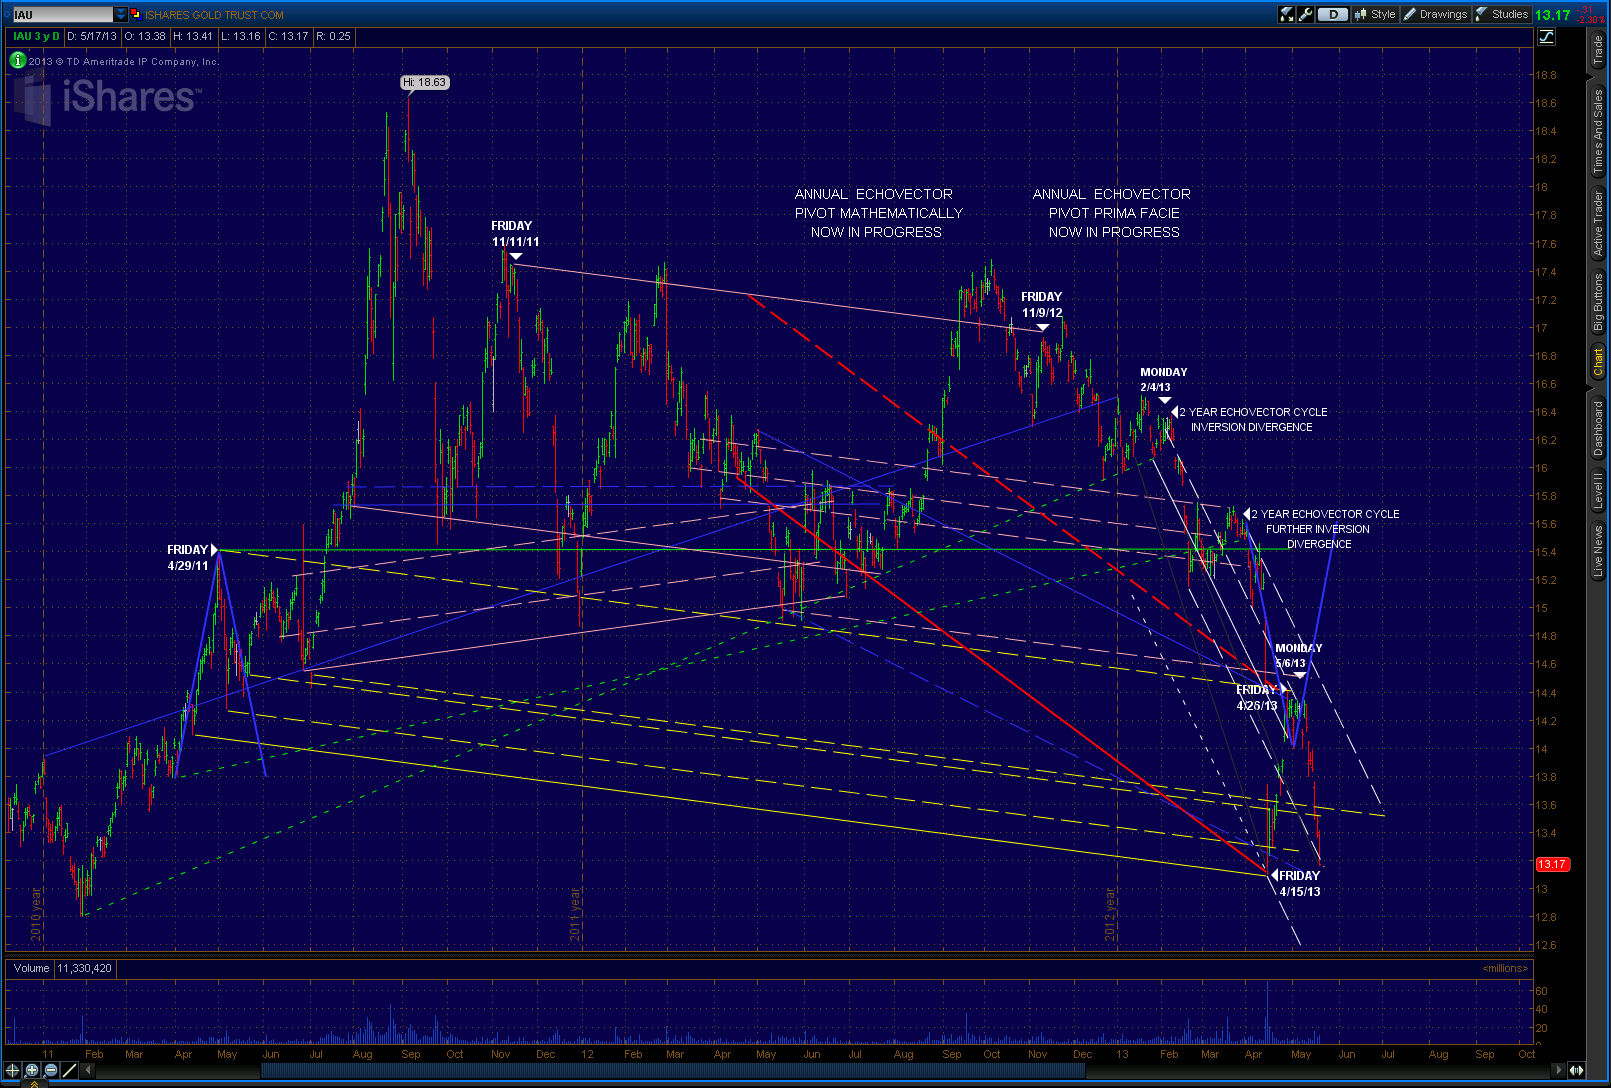
THE IAU ETF 2-YEAR DAILY OHLC
(Click on chart to enlarge and continue to click to further zoom)
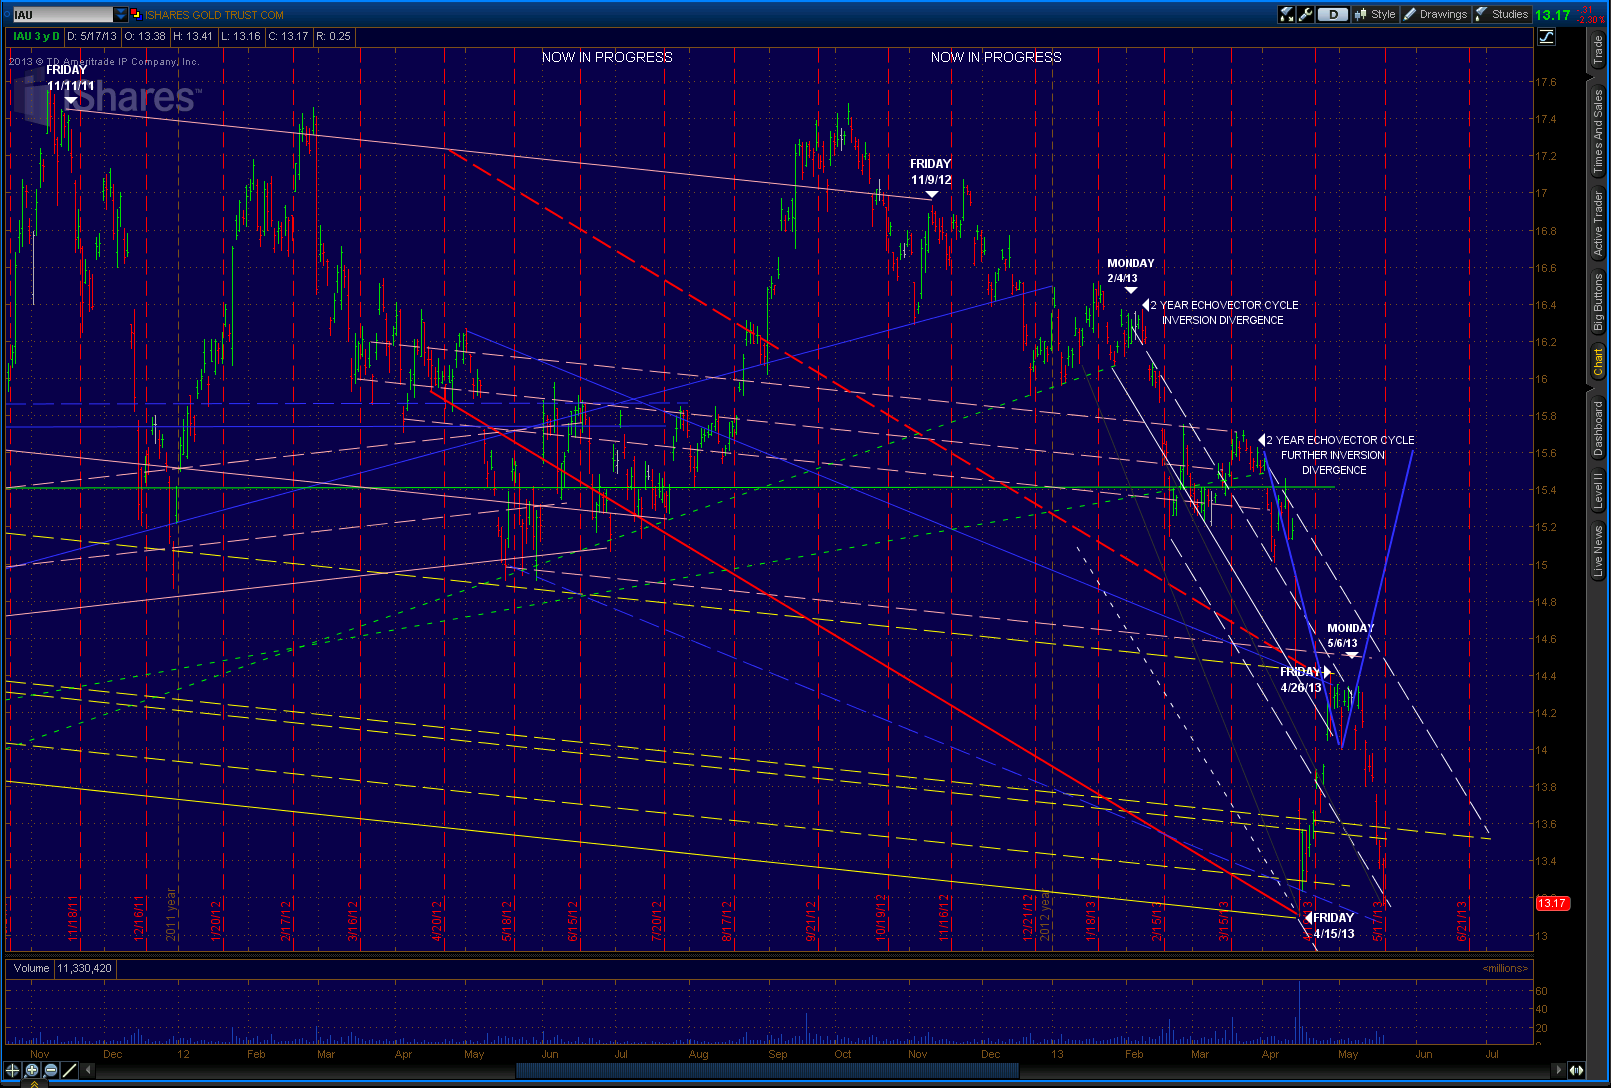
THE IAU ETF 18-MONTH DAILY OHLC
(Click on chart to enlarge and continue to click to further zoom)
THE IAU ETF 3-YEAR DAILY OHLC
(Click on chart to enlarge and continue to click to further zoom)
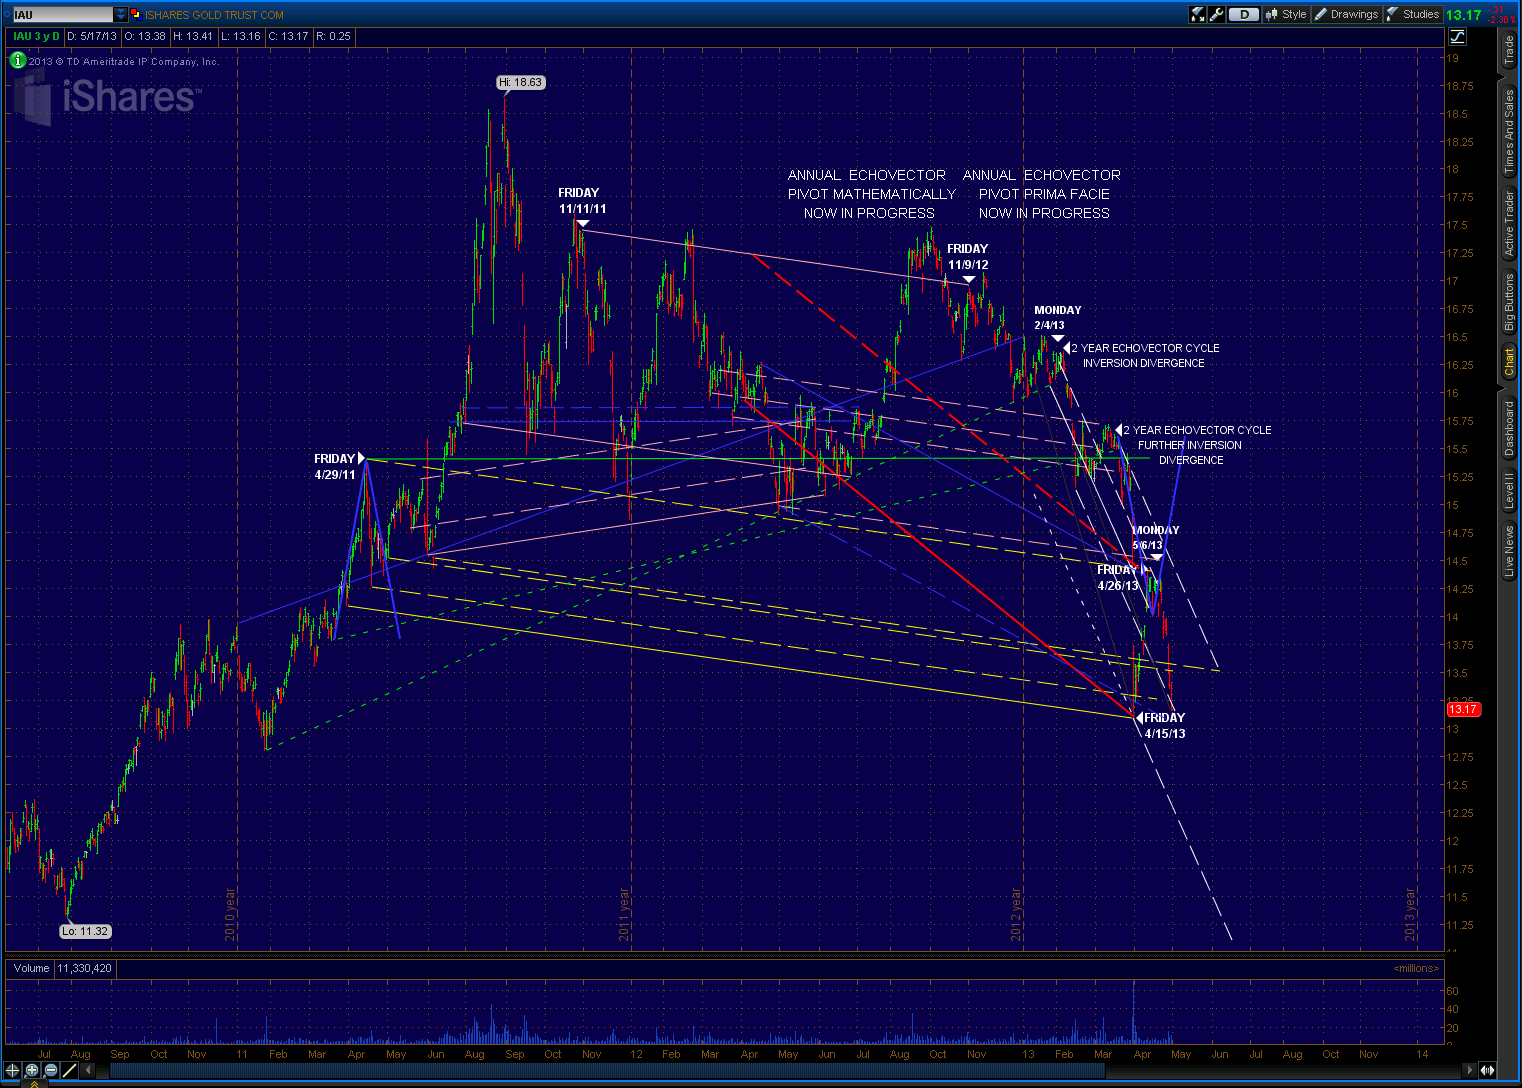
The IAU shows much the same pattern as the /GC when looking at both the longer-term and the shorter-term perspectives. The 3-year chart of the IAU also indicates that a failure to hold support in $12.75 to $13.25 area this month could quickly move us down to the 2010 summer (end of July 2010) lows of $11.25 to $11.50. Then again, this might make gold that much more interesting as we move into late summer and early fall season demand.
THE GTU ETF 3-YEAR DAILY OHLC
(Click on chart to enlarge and continue to click to further zoom)
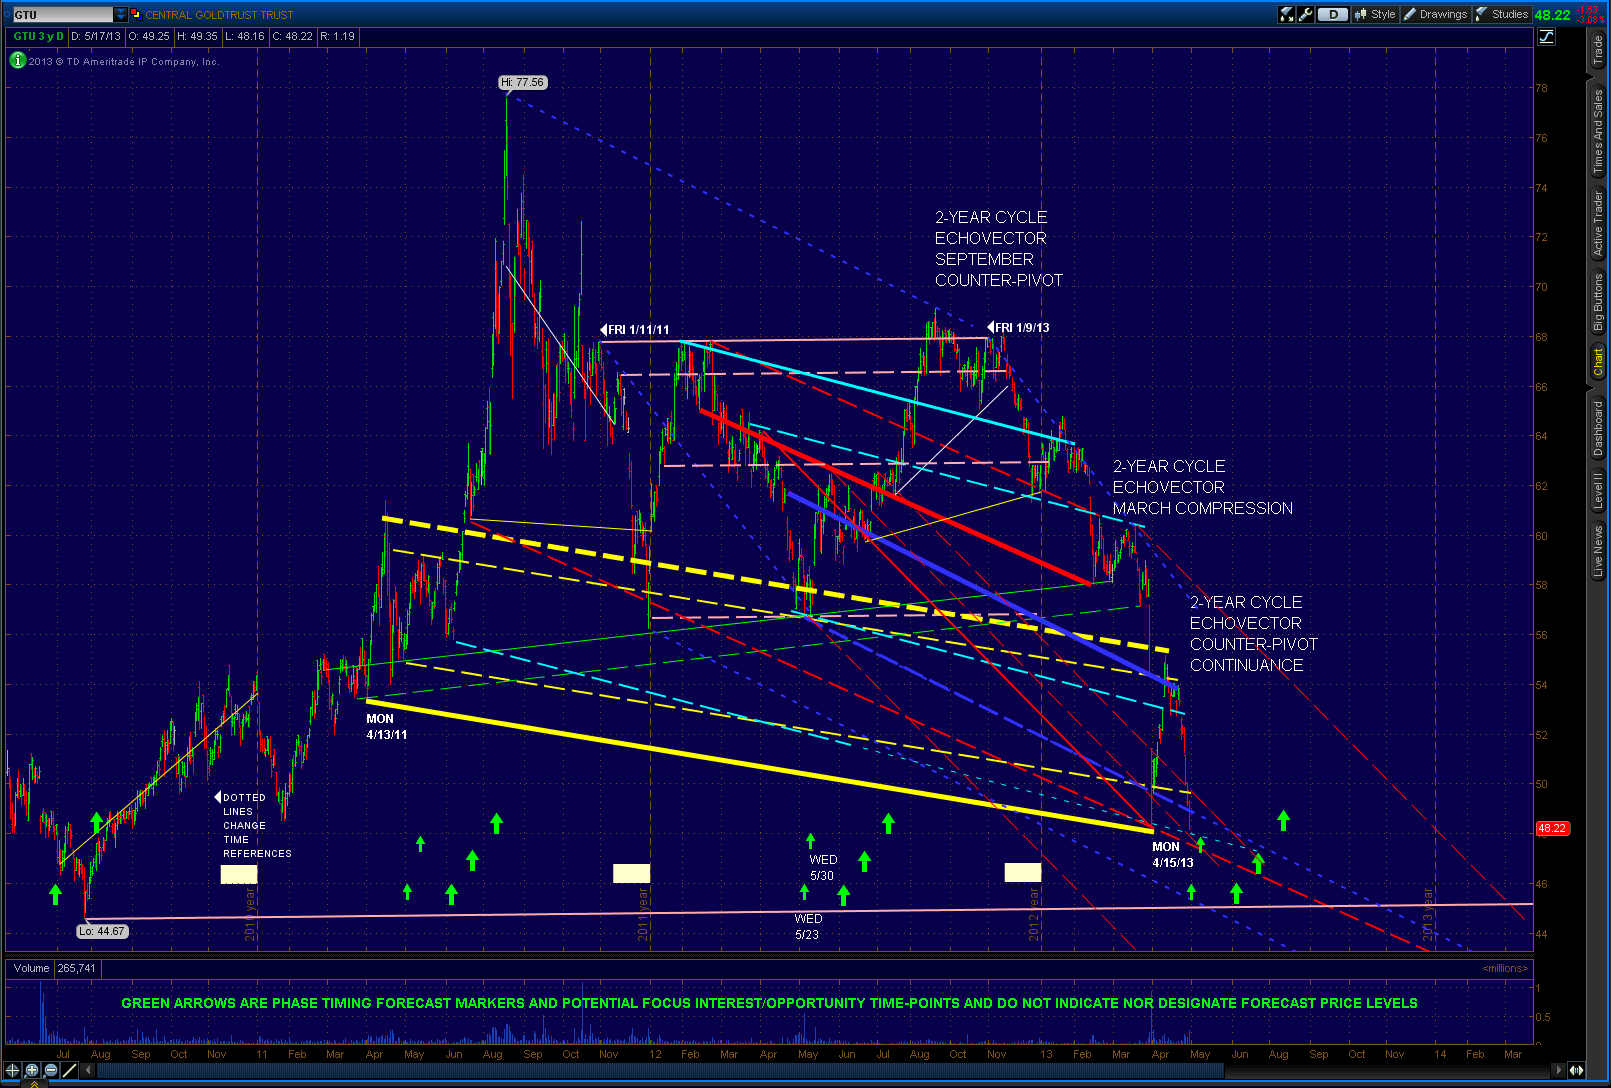
The GTU chart serves to also clearly, and more precisely, illustrate the cyclical summer seasonal support that has occurred in the last several years that may become a factor the next eight weeks or so this year. This chart could give gold bulls some short-term technical encouragement regarding the coming months, especially at the lower $44.60 to $45 level. This level on the GTU compliments the $11.25-$11.50 range on the IAU.
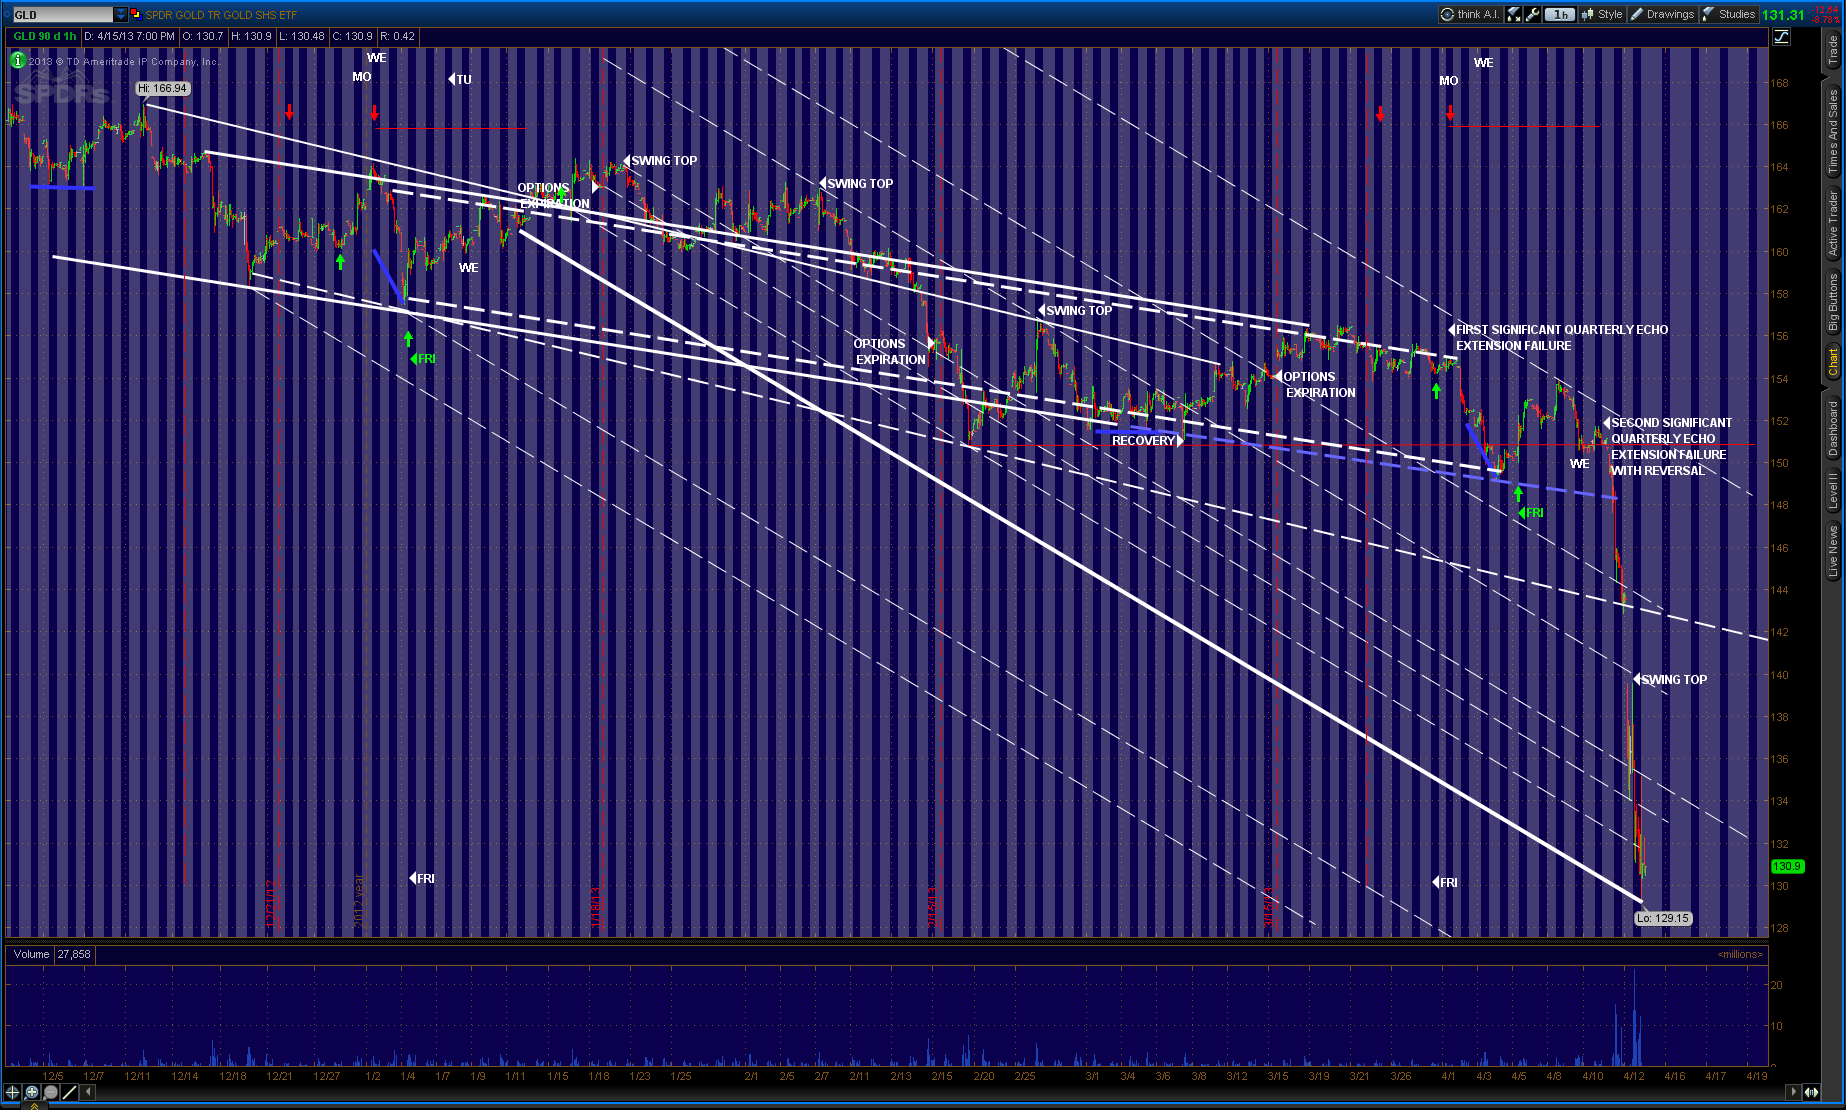
THE GLD ETF 9-MONTH DAILY OHLC
(Click on chart to enlarge and continue to click to further zoom)
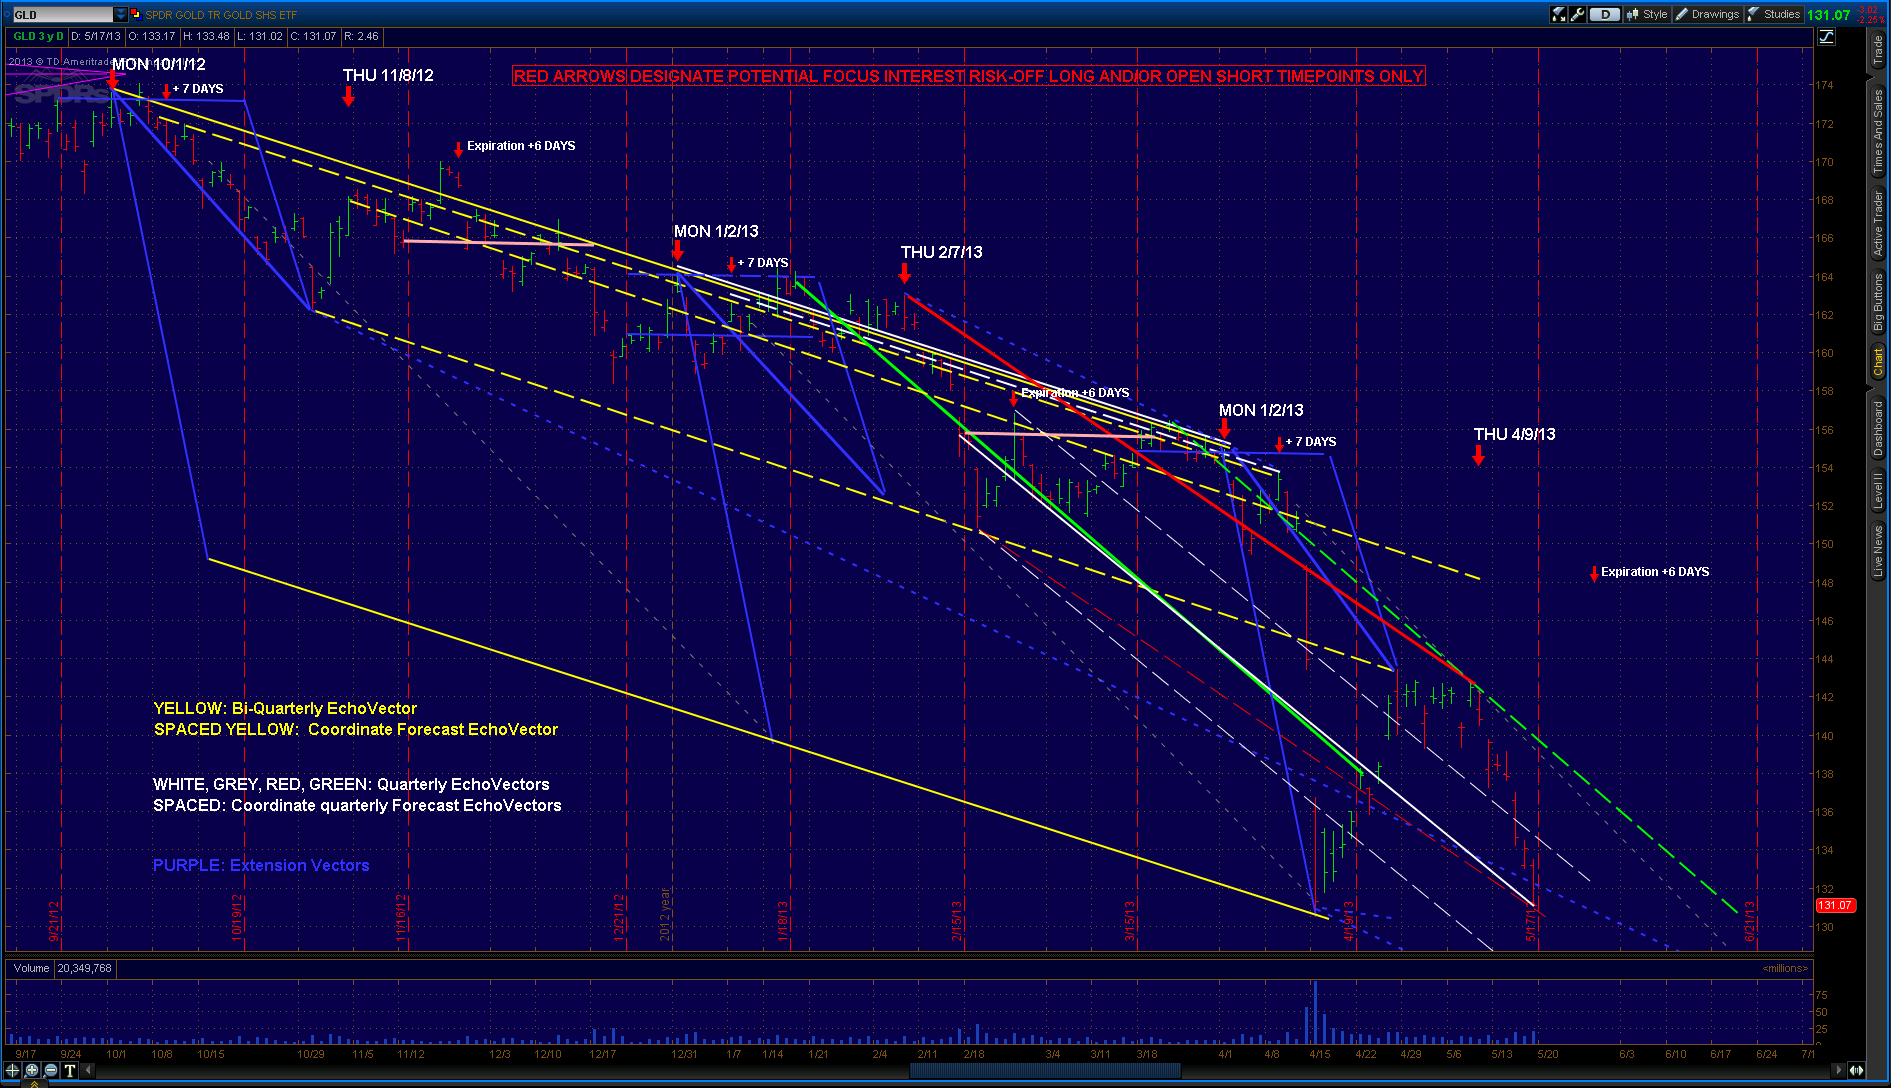
For most gold enthusiasts, this particular chart of the GLD may be considered the most ominous chart I present.
A close inspection of the chart, and a more advanced mathematical understanding of its information, indicates that, as we've have moved through this last month, down-side pivoting action did not mitigate significantly. Hence, our re-test this past week to previous lows, and with it now a threat of further fall. This might support a case that any increase in 'coming seasonal buying interest' may end up just 'offsetting the selling down-pressure a bit', and not turn prices nor short-term momentum around very much, if at all.
If we do happen hold in the current price area for the next several bi-weekly periods, prospects for the GLD's return to $145-$155 range by October may again start to gain some traction. A turn up-through the far right spaced-green quarterly coordinate forecast resistance echo-vector highlighted on this chart would serve this bullish prospect, and begin to lend some much needed technical support to such an outlook.
CONCLUSIONS AND POSITIONING IMPLICATIONS
Given what I believe I've found so far in the above charts, my assessment regarding a re-entry strategy in gold this year actually remains much as it did in February. I would wait for summer's price compression and support to materialize, if it does, before I consider wading very far into gold's volatile waters. And then, when I do, I would have my 'ring buoy' firmly fixed around me (in the form of solid stops). At present, I would not expect much up-tide rising float along the way.
Also, presently I would not be looking to actively 'long-side trade' gold past early October of this year, for those of you who are "gold investment oriented," and wondering about 'buy-and-hold to year's end' prospects. But I also submit, that I, like anyone else, can be humbly surprised. And that's okay, as long as I've protected my gains on each side when right along the way, and I'm readily stopped out from any real adversity when I'm not. Besides, we are a ways off-- and this leads me to my next point.
In the present gold market environment-- and for more advanced and nimble gold market participants, when they do believe the time has come to re-enter gold-- I suggest the employment of active and adjustable straddling positions to manage exposure to general price level changes. Setting advanced management straddles at key coordinate forecast levels is an effective and opportune measure, and advanced trade strategy. Such an approach is particularly well-tailored to -- and could prove very valuable in-- engaging and effectively managing this volatile gold market going forward into fall, and beyond.
One way to employ such a straddle would be to utilize the GTU, GLD, or IAU ETFs. By setting up an advanced trade technology (see "On-Off-Through Vector Target Price Switch")-- for example, at $11.25 on the IAU or at $44.60 on the GTU, with appropriate dynamic triggers and stops included-- such a straddle can be employed.
To perform the short side of the straddle, set a short trigger below either of these mentioned target price switch levels (e.g., $11.25 on the IAU and/or $44.60 on the GTU) pre-programmed as a "repeating short trigger switch" at the trigger level on reverse downtick action through the trigger price, with stops set to activate on reverse uptick up-through action. To perform the long side of the straddle, set a long trigger above either of these the target price switch levels ($11.25 on the IAU and/or $44.60 on the GTU) pre-programmed as a "repeating long trigger switch" at the trigger level on reverse uptick action through the trigger, with stops set to activate on reverse downtick down-through action.
Now may be a very good time to employ this gold market straddle and this more advanced trade technology and active position management methodology, especially when considering the level of volatility we have just witnessed since my February warning in gold earlier this year.
Those readers who have followed this strategy since February have not only saved 20 percent on the downside, but have earned 20% more on the short side (and even more using derivatives), and are ahead of gold market buy-and-hold participants by 40% in just the base underlying GLD ETF gold instrument, all in less than a quarter.
I believe most participants would call accomplishing this 'getting gold right.'
For those of you interested, I will try to see to it that multiple gold perspectives, including the daily, 3-day, weekly, bi-weekly, monthly, bi-monthly, quarterly, bi-quarterly, annual, and bi-annual perspectives, highlighted with key active echo-vectors and coordinate forecast echo-vectors and echo-back-dates, are freely available at both ECHOVECTORVEST and GOLDPIVOTS, and also get posted regularly at SeekingAlpha.
Godspeed in your gold investing and trading, and thanks for reading.
PROMISED FOOTNOTE:
CHART HIGHLIGHTS INTERPRETATION COLOR CODE GUIDE
1. Regime Change Cycle EchoVector (8 Year, Week of month): Long Aqua-Blue
2. Regime Change Cycle EchoVector (8 Year, Week of month): Long Yellow
3. Regime Change Cycle EchoVector (8 Year, Week of month): Long Pink
4. Presidential Cycle EchoVector (4 Year, Day of week): Long White
5. Congressional Cycle EchoVector (2 Year, Day of week): Green
6. Congressional Cycle EchoVector (2 Year, Day of week): Blue Purple
7. Congressional Cycle EchoVector (2 Year, Day of week): Long Pink
8. Congressional Cycle EchoVector (2 Year, Day of week): Long Yellow
9. Annual Cycle EchoVector (1 Year, Day of week): Red
10. Annual Cycle EchoVector (1 Year, Day of week): Pink
11. Annual Cycle EchoVector (1 Year, Day of week): Aqua-Blue
12. Annual Cycle EchoVector (1 Year, Day of week): Long Blue Purple
13. 9-Month Cycle EchoVector (9 Months, Day of week): Grey
14. Bi-Quarterly Cycle EchoVector (6 Months, Day of week): Yellow
15. Bi-Quarterly Cycle EchoVector (6 Months, Day of week): Grey
16. Quarterly Cycle EchoVector (3 Months, Day of week): White
17. Quarterly Cycle EchoVector (3 Months, Day of week): Grey
18. Quarterly Cycle EchoVector (3 Months, Day of week): Red
19. Quarterly Cycle EchoVector (3 Months, Day of week): Green
20. Select Support or Resistance Vectors and/or Relative Price Extension Vectors (Various Lengths): Navy Blue
Spaced Highlights are corresponding focus interest time-point based coordinate forecast echo-vectors (projecting potential pivots, flex-points, support, and resistance areas)
- Gold Chart: Price May Be Right, But Is Timing? Wed, Feb 27
- Gold Chart: Cyclically An Important Week In Gold Mon, Feb 11
- Don't Fight The Fed Wed, Aug 1

No comments:
Post a Comment
Note: Only a member of this blog may post a comment.