


"Stock Market Momentum Across The Clinton, Bush, And Obama Midterm Election Years, And What It May Indicate For This Year And Next" Article Update Revisited [Edit or Delete]0 comments
This coming week is a particularly import week in the market.While this past weeks sell-off to current price levels was precisely forecast last weekend using EchoVEctor Analysis and focusing on the quarterly, bi-quarterly, and annual cycles and cycle echovectors at work, the call for price support and price momentum sign reversal found this week, on a week-over-week basis within the quarterly and bi-quarterly echovector momentum indicator cycle (in order to prevent significant and regular regime change cycle, presidential cycle, and congressional cycle price erosion in this summer's phase of each of these cycles and their respective periodicities - see alerting article below - and which were also in phase regarding this past week's price pivot into the summer) is now particularly evident.See highlights of the past two quarterly echovectors at SeekingAlphaand at THE MARKET PIVOTS FORECASTER AND POSITION MANAGEMET NEWSLETTER Free Online. Find graphical illustrations of Active Advance Management Trader's Edge EchoVector Analysis FrameCharts and Active Advanced Management OTAPS-PPS Position Polarity Switch Signal Price Target Vector GuideMaps -- Generated and Displayed For Selected Position Polarity Switching Focus Interest Opportunity Price ActionTimeFrames and Scopes --- including graphical illustrations and highlights of currently active OTAPS-PPS Extension Vector Price Polarity Switch Targets (Actionable Inflection Point Schedules) and currently active and select EchoVector Pivot Point Price Projections (EV-PPPs) schedules and targets.The MDPP Forecast Model And Alert Paradigm and Active Advanced Risk Management Standardized Position Value Optimization Strategy Calculation and Methodology generated a significant Alert for large cap equities a week ago Friday, with significant short-term short double-double leverage exposure bias (ultra on margin and/or MDPP designated Level 4 advanced derivative basket) and focus interest period opportunity. This alert also came with further potential intermediate-term short caution potential (down-pressure into the summer season), depending on this week's price action.The MDPP EchoVector Analysis "Weekly Phase Within Seasonal Phase Within Annual Cycle" Protection Quotient turned very high last weekend.See this week's current key EchoVector Pivot Point Projection forecasts and OTAP-PPS Inflection Point Action Targets illustrated and highlighted for the presidential cycle, the congressional cycle, the annual cycle, the bi-quarterly cycle, the quarterly cycle, the monthly cycle, the bi-weekly cycle, and the weekly cycle.Daytraders and short-term swingtraders can also see shorter-term daytrading scale echovectors, coordinate forecast echovectors, and echovector pivot point projection schedules graphically illustrated and highlighed in select EchoVector Analysis Trader's Edge Framecharts highlighting and illustrating key 1-day, 2-day and 3-day echovector analysis cycle periods and their active echovectors and echovector pivot points within key active weekly, bi-weekly, and quarterly cycles, and their coordinate forecast echovectors and echovector pivot point projection schedules, as they become publicly available.____________________________________________________Stock Market Momentum Across The Clinton, Bush, And Obama Midterm Election Years, And What It May Indicate For This Year And Next [Editor Delete]0 commentsMar 10, 2014 7:56 AMStock Market Momentum Coordination Across The Clinton, Bush, And Obama Midterm Election Years, And What It Indicates This Year And Next
Summary- The bull market is ready to celebrate its 5TH anniversary, but how much longer will the bull run?
- The modern era in market structures, market participation, and advance forecasting techniques may help generate its own momentum.
- Inspection of stock market prices reveals a pattern of melt-up after midterm election years in last three US Administrations, and the era of the Internet.
- Stock market momentum in these years is right on course and offers a strong indicator for this year's forecast. See April 1997 to April 2005 to April 2013.
- Prices appear toppy now going into June this year, but symmetry transposition from the last two regime change cycles also supports the case for an additional up-wave from this coming fall's lows.
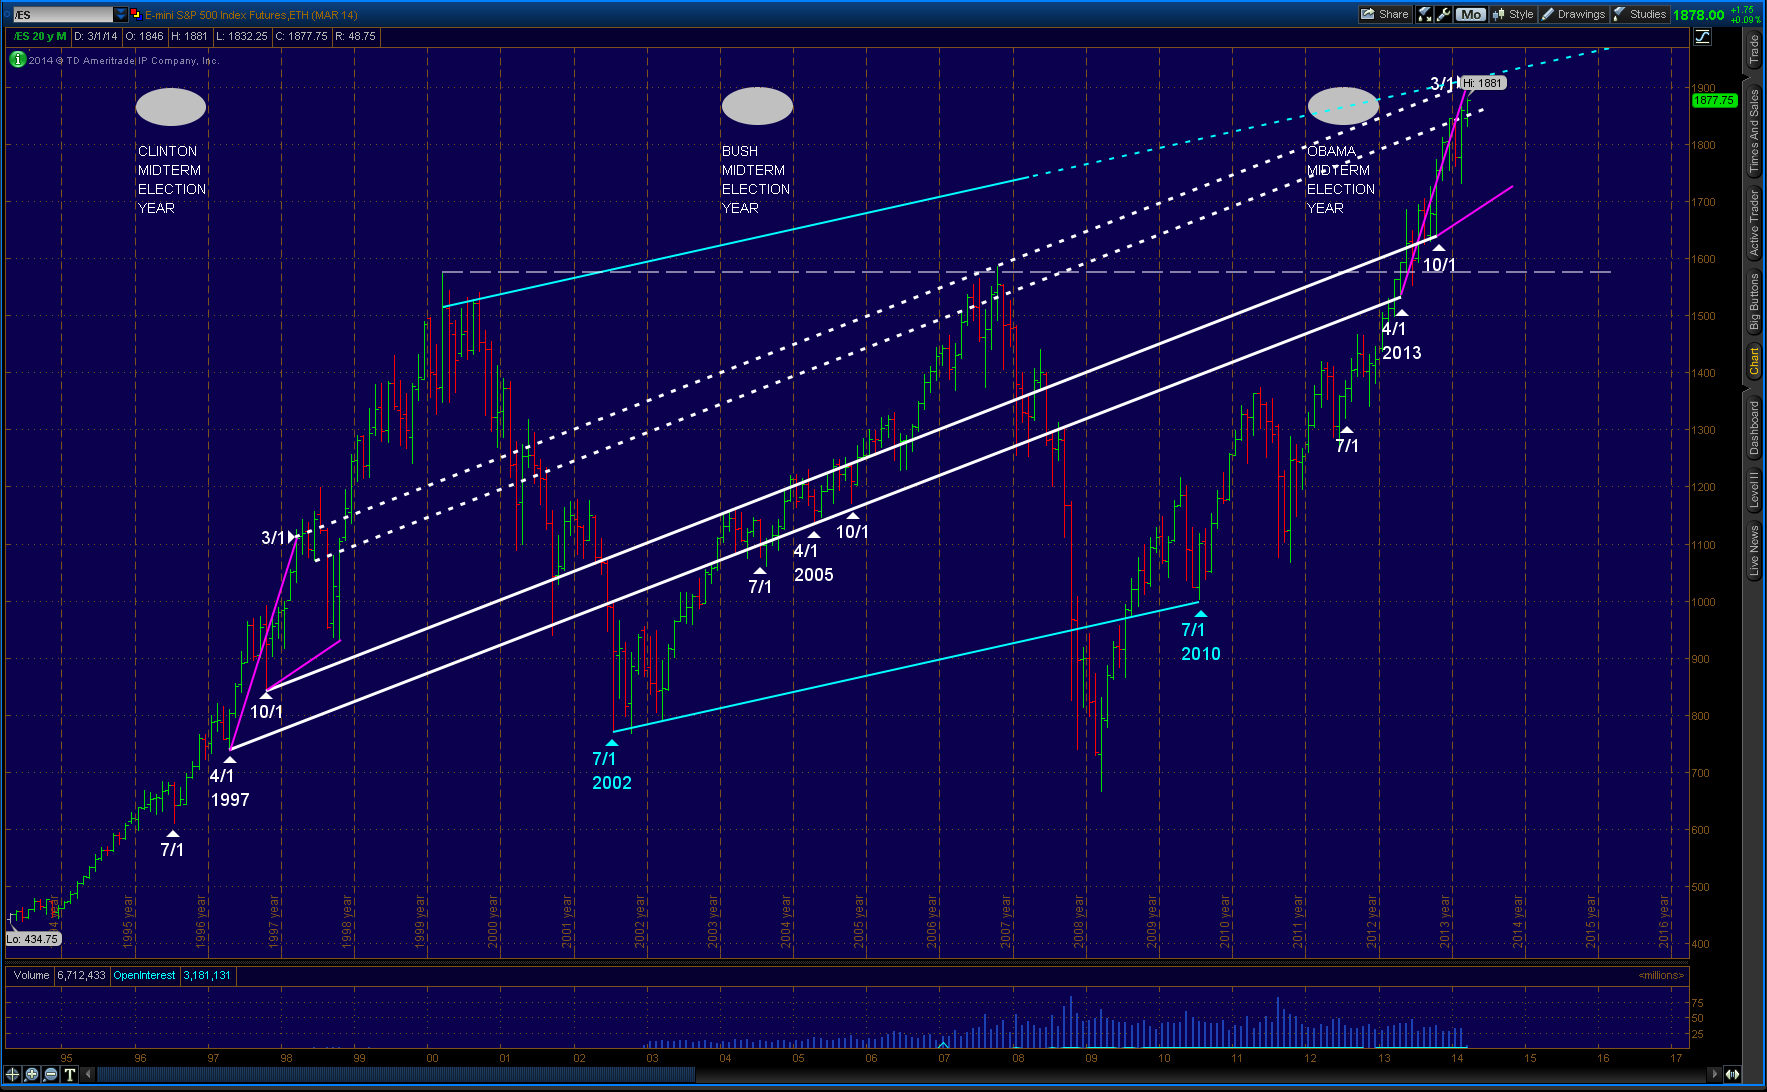
ARTICLEBACKGROUNDThis week several analyst have published articles celebrating the markets 5-year bull run since the lows of the great 2008-2009 sell-of the second week of March 2009. Few bull markets have last longer than five years. What I find interesting is many of these each article's primarily thesis is on the technicals, and assessing longer term historical bull market lengths and measures. One even states "Part of what makes it so difficult to forecast what is going to happen next right now is history's lack of clear insight." This often gets mentioned in periods of price over-extension, whether up or down. I do not agree with this assessment, and believe instead that history does give insight if you are looking in the right place and within the right contextual and analytic framework.Perhaps a closer review of shorter-term history covering the last 20 years might give us important new insight into where the market may go from here. A review that also takes into account the political economic cycles as well as key and consistent market momentum indicators, while also considering internationally coordinated central bank imperatives and interventions. Also accounting for, and contexting, vast structural changes in market evolution is importantDramatic structural changes in the stock market through the last 20 years, and an explosion in market participation during the age of the Internet have occurred. Windows 95 has a 20 year birthday coming up. So it's not the market your grandfather use to trade, if he traded one at all. Broad market participation across the globe is also expanding. The evolution in market structure, in market participation, and in analytic tools and techniques has been breathtaking. All three of these evolving market components lend themselves to the development of new analytic frameworks in understanding market price dynamics and forecasting. This is especially the case within the overall advancement of computer supported market analysis, black box investing approaches, and the ever accelerating and voluminous information age.I believe a different and closer inspection of the market focusing on the political economic cycle, and specifically the last three presidential administration cycles and the 2 years following the midterm presidential elections, and recent key central bank price stabilization imperatives, and the utilization of the EchoVector Market Momentum Indicator through these periods, may be particularly useful now in framing a valid understanding where the market may move next.THE FEDERAL RESERVE AND STABILIZING MIDTERM ELECTION YEAR PRICESIn August of 2012 I wrote an article examining the Federal Reserve Bank's interest in avoiding excessive market volatility in the a presidential midterm election year of 2012, and instead the Bank wanting to be a significant and effective force and national institution promoting economic stability and economic encouragement to the American electorate during that important political economic and financially sensitive time. In that article, titled Don't Fight The Fed, I explained how the US Federal Reserve Bank lead a global central bank coordinated and orchestrated effort to support stock prices and the wealth effect with a Federal Reserve Bank generated composite stock market price support level bridge during one of the most vulnerable periods in the political economic cycle. Supporting composite stock market price levels and preventing potentially ensuing cyclical price level erosion, and positively trajectoring prices further upward instead, was the purpose of this coordinated global central bank intervention.This article is a follow-up of my previous article. In it I would like to focus on, and to review, how large cap composite equity prices have in fact responded to this past mid-term American presidential election cycle globally coordinated central bank intervention which occurred in the summer of 2012 within the US political economic cycle, and to take a closer look at the current market price level trajectory induced by the central bank when viewed within the context and the time span of stock market price levels over the last three 8-year American presidential regimes: the Clinton regime, the Bush regime, and now the Obama regime.A LOOK AT THE LAST THREE US PRESIDENTIAL ADMINISTRATIONS' POST MIDTERM ELECTION MELT-UPS IN STOCKSLet's begin by looking at the following 20-year price track of the S&P 500 Composite Stock Index as reflected a proxy chart of the popular /ES E-mini Futures on that index.S&P 500 Stock Composite Index /ES E-mini Futures 20-Year Monthly OHLC Perspective(click to enlarge)In the chart above note the key white 16-year market financial cycle echovector running from The April 1, 1997, the echobackdate and year following the Clinton Administration mid-term election year, to the April 1 2005 echobackdate and year following the Bush Administration mid-term election year, to the April 1 2013 echovector start date, and year following the Obama Administration mid-term election year.Notice also the general horizontal price resistance level highlighted in white running from the Clinton Regime's price level toppiness in year 2000 to the Bush Regime price level toppiness in year 2007 to the late spring and summer time sell in May and go away period of the Obama Regime in 2013.In May of 2013 prices had faltered at this critical time and price level and fell nearly 10% into June. Rallying off the June lows prices began to fall back again in August, potentially setting up a toppy formation much like that in 2007.It was in the Federal Reserve Bank's genuine interest, and in The Federal Reserve Bank Chairman's focus, his specialty, and his legacy interest, to prevent another market collapse reminiscent of 2008 or 2001-2002, and this seasonal price pressure weakness from accelerating into a more precarious market price phenomena and political economic market cycle echo. And the central bank's ensuing coordinated efforts to place a bridge under stock market prices that summer could not have been more effective nor better timed for this purpose.The bridge in place, and holding well into November, and that month's returning annual and congressional cycle lows kicking in, with them occurring at these upper and bridged supported price levels, set the stage for significantly better price level momentum trajectory than otherwise, and eventual price level resistance breakthrough and price melt-up, in lieu of price level collapse. Whereas these last three regime mid-term election years appear characterized by little price progress going into July after their first quarter highs, the year that follows, being year 5 in the existing administration's regime change cycle, holds onto momentum price gains on both a year-over-year basis and on a 2-year congressional cycle basis. The latter being even stronger, accelerating prices even further and propelling them into melt-up. This effect was anticipated in my article of August 2012, and has been central to my positive market forecast since.OUTLOOKSome analyst have been calling for a pullback from high's this quarter into lower lows this fall, with a bounce back to higher highs going into next year. The above analysis would tend to support such an outlook.However, currently vigilance and caution at the high price level present may be the better part of wisdom. We have gained over 44% on the S&P since August 2012, and have completed what might be viewed, at best, as the first half of a melt-up that occurs before a potential second wave of melt-up cyclically begins in the second half of this year. Be mindful that sometimes the market, anticipating far enough into the future cyclically, seems to rush to get there early, accomplishing momentum over-extension. This might have also, in part, contributed to the drama of 2008 with regard to downside extension.At this time within this regime change cycle within the political economic cycle, and at current price levels, my suggestion is to remain nimble, and to let the best price extension scenario evolve, but to also remain ready to lock in gains through hedging utilities in the event of scope relative counter-cyclical occurrences, and to do so possibly right up into the second quarter of next year.One way to accomplish being nimble would be to set up an active and adjustable OTAPS position polarity switch and straddle to manage your general stock market exposure to any potential changes in the general price level momentum and your forward outlook. Setting straddles at momentum echovector switch level prices is an effective and opportune measure and advanced trade and position management strategy.One way to employ such a straddle would be to utilize the SPY ETF and/or the DIA ETF. By setting up an advanced trade technology (see "On-Off-Through Vector Target Price Switch") at, for example, $190 on the SPY or at $166 on the DIA, with appropriate dynamic triggers and stops included, such a straddle can be employed.To perform the short side of the straddle, set a short trigger below either of these mentioned target price switch levels (e.g., $190 on the SPY and/or $166 on the DIA) pre-programmed as a "repeating short trigger switch" at the trigger level on reverse down-tick action through the trigger price, with stops set to activate on reverse uptick up-through action.To perform the long side of the straddle, set a long trigger above either of these the target price switch levels ($190 on the SPY and/or $166 on the DIA) pre-programmed as a "repeating long trigger switch" at the trigger level on reverse uptick action through the trigger, with stops set to activate on reverse down-tick down-through action.Now may be a very good time to employ this general market straddle and this more advanced trade technology switch and active position management methodology, especially when reviewing the proxy chart of the S&P 500 over the past 20 years within the current presidential regime change cycle.Thanks for reading. And Godspeed in your investing.Disclosure: I have no positions in any stocks mentioned, and no plans to initiate any positions within the next 72 hours.Market Alpha Brand Newsletters Group, PROTECTVEST AND ADVANCVESTKevin John Bradford Wilbur is the Chief Market Strategist and Senior EchoVector Analysis Methodologist at PROTECTVEST AND ADVANCEVEST. He is a prize-winning Economist and Financial Physicist with an over 35 year span of experience and awards in Academics, Research, Management, Practice and Trade. Kevin has specialized experience in the Major Market Indexes, Commodities, ETFs, and in derivatives and the derivatives markets.DISCLAIMERThis post is for information purposes only.There are risks involved with investing including loss of principal. PROTECTVEST AND ADVANCEVEST BY ECHOVECTORVEST MDPP PRECISION PIVOTS makes no explicit or implicit guarantee with respect to performance or the outcome of any investment or projections presented or discussed by PROTECTVEST AND ADVANCEVEST BY ECHOVECTORVEST MDPP PRECISION PIVOTS.There is no guarantee that the goals of the strategies discussed by PROTECTVEST AND ADVANCEVEST BY ECHOVECTORVEST MDPP PRECISION PIVOTS will be achieved.NO content published by us on the Site, our Blog, and any Social Media we engage in constitutes a recommendation that any particular investment strategy, security, portfolio of securities, or transaction is suitable for any specific person. Further understand that none of our bloggers, information providers, App providers, or their affiliates are advising you personally concerning the nature, potential, value or suitability of any particular security, portfolio of securities, transaction, investment strategy or other matter.Again, this post is for information purposes only.Before making any investment decisions we recommend you first consult with you personal financial adviser.Disclosure: I have no positions in any stocks mentioned, and no plans to initiate any positions within the next 72 hours.This article is tagged with: Market OutlookDisclosure:Themes: Stock Market Education, Futures, Federal Reserve, Market Currents, ETFs, Macro View, Alerts, Market Outlook, ETF Long and Short Ideas, ETF Analysis, Commodities, EchoVector Pivot Points, Technical Analysis, MDPP Precision Pivots Forecast, EchoVectorVEST Stocks:QQQ, PSQ, QLD, QID, IWM, RWM, UWM, UKK, TWM, DIA, DOG, DDM,DXD, TLT, TLH, IEF, UUP, UDN, GLD, GTU, DGZ, UGL, DZZ, GLL, IAU,SGOL, SLV, DBS, AGQ, ZSL, CU, PALL, PPLT, VXX, UVXY, XIV, TVIX,XLI, TNA, SPXU, IVV, TQQQ, SQQQ, SPLV, SPY, SSO, SDS

Thursday, June 12, 2014
ES S&P500 US LARGE CAP EQUITIES COMPOSITE INDEX EMINI FUTURES PROXY ECHOVECTOR ANALYSIS FRAMECHART AND PRICE PATH GUIDEMAP UPDATE WITH KEY OTAPS-PPS EXTENSION VECTORS HIGHLIGHTED: POWERFUL FORECAST RIGHT ON TARGET: FRIDAY 13, 2014: ASIAN MARKET HOURS
POWERFUL RESULTS THIS WEEK WITH ECHOVECTOR ANALYSIS FORECAST RIGHT ON TARGET: LEVEL ONE DERIVATIVES STRATEGY YIELDS 3-FOLD (300%) FROM MONDAY TO CLOSE ON THURSDAY.
WEEKLY CAUTION ALERT REITERATION: US LARGE CAP MARKET COMPOSITE SELL-OFF ON QUARTERLY ECHOVECTOR AND BI-QUARTERLY ECHOVECTOR BASIS: HIGH RISK TO STL POSITIONS: STS POSITION BIAS WITH DOUBLE-DOUBLE STRATEGY (ULTRAS ON MARGIN) AND LEVEL 4 DERIVATIVES STRATEGY FORECAST SCENARIO
ES S&P500 US LARGE CAP EQUITIES COMPOSITE INDEX EMINI FUTURES PROXY ECHOVECTOR ANALYSIS FRAMECHART AND PRICE PATH GUIDEMAP UPDATE WITH KEY OTAPS-PPS EXTENSION VECTORS HIGHLIGHTED: POWERFUL FORECAST RIGHT ON TARGET: JUNE 13, 2014: ASIAN MARKET HOURS - EARLY MORNING USA
/ES ECHOVECTOR FRAMECHART UPDATE: PREMIUM DESK PARTIAL RELEASE TO ALPHA BRAND NEWSLETTERS: NOW AVAILABLE FREE ONLINE
SEE PRIOR ALERTS AND ALERT SUMMARIES
WEEKLY ALERT REITERATION: STRONG STS BIAS THURSDAY MORNING WITH COVER FRIDAY: SEE QEV
MARKET-PIVOTS.COM AND STOCK-PIVOTS.COM AND SPYPIVOTS.COM AND DOWPIVOTS.COM AND
E-MINIPIVOTS.COM AND ETFPIVOTS.COM AND MARKETPIVOTSONLINE.COM
SEE ECHOVECTOR CYCLE LENGTH FULL COLOR CODE GUIDE AT
ECHOVECTORVEST MDPP PRECISION PIVOTS MODEL ECHOVECTOR AND COORDINATE FORECAST ECHOVECTOR AND ECHOVECTOR PIVOT POINT PROJECTIONS FORECAST FRAMECHART AND PRICE MAP ILLUSTRATIONS AND HIGHLIGHTS COLOR CODE GUIDE
ECHOVECTOR FRAMECHART ABBREVIATED COLOR CODE GUIDE
(QUICK-CODE GUIDE)
Open EchoVector Framecharts in new tab and click to enlarge and click again to further zoom.
/ES S&P500 LARGE CAP COMPOSITE INDEX EMINI-FUTURES
6-MONTH (BI-QUARTERLY) OHLC (DAILY) ECHOVECTOR ANALYSIS FRAMECHART PERSPECTIVE AND TRADER'S EDGE PRICE GUIDEMAP HIGHLIGHTED

_______________________________________________________________________________________________________________
June 2, 21014 UPDATE
/ES S&P500 LARGE CAP COMPOSITE INDEX EMINI-FUTURES
16-YEAR (MATURITY CYCLE) OHLC (MONTHLY) ECHOVECTOR ANALYSIS FRAMECHART PERSPECTIVE AND TRADER'S EDGE PRICE GUIDEMAP HIGHLIGHTED


No comments:
Post a Comment
Note: Only a member of this blog may post a comment.