


SPY And DIA, And Correlated Mini-Futures: Chronicle Of Results For Friday May 11, 2012, In Accordance With This Morning's Published Pre-Market Analysis, Forecast, And Suggested Strategies, And Today's Additional Published Posts [Edit or Delete]0 comments
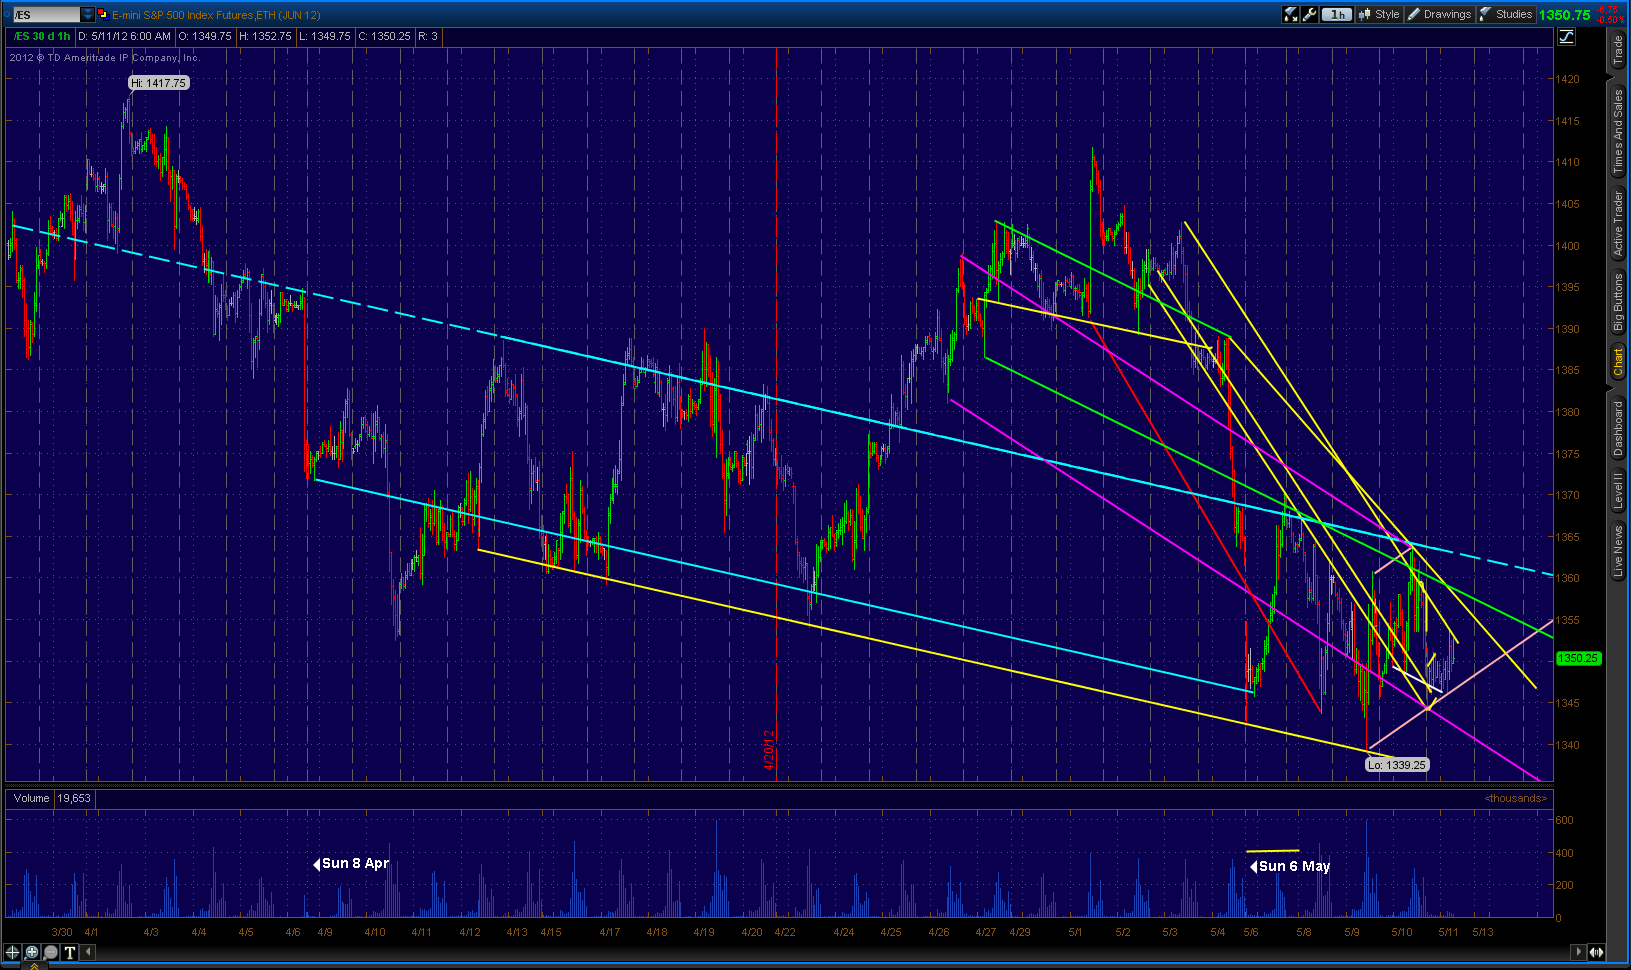
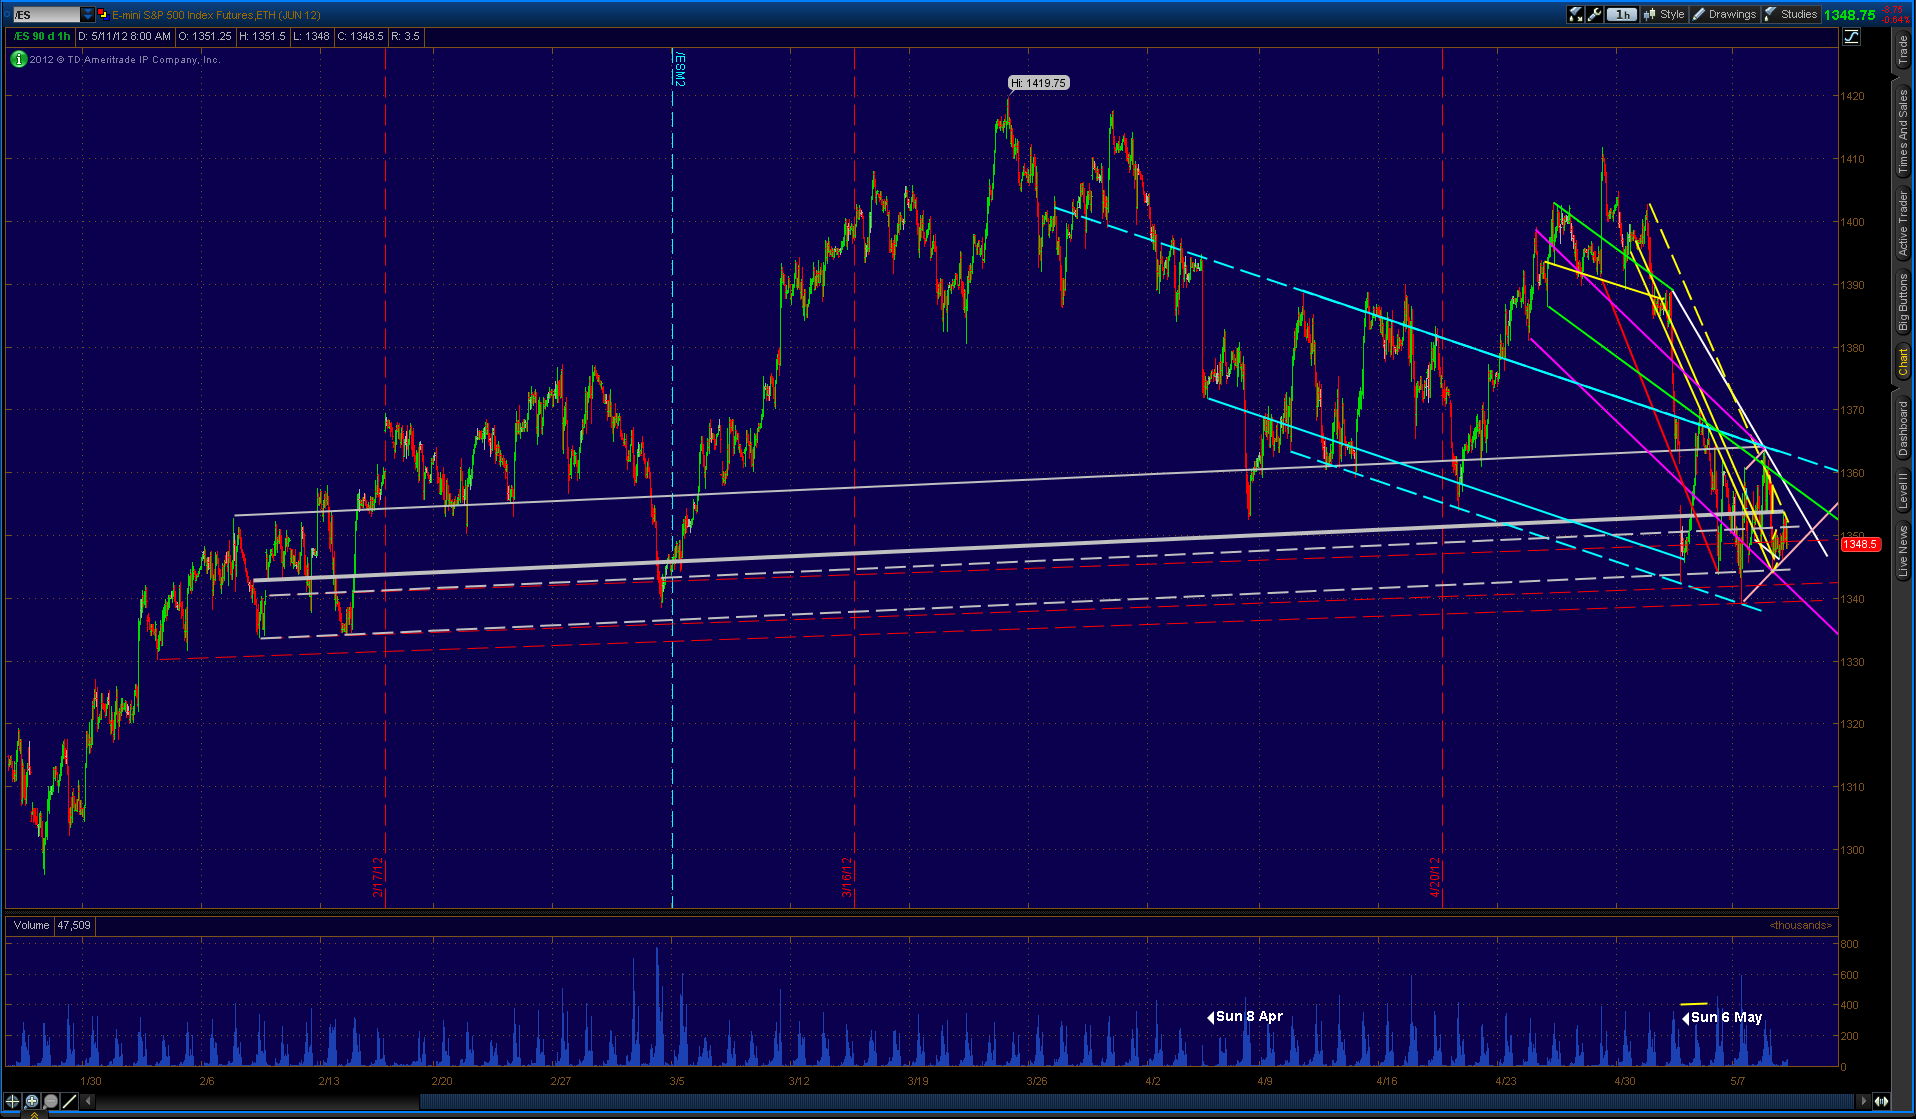
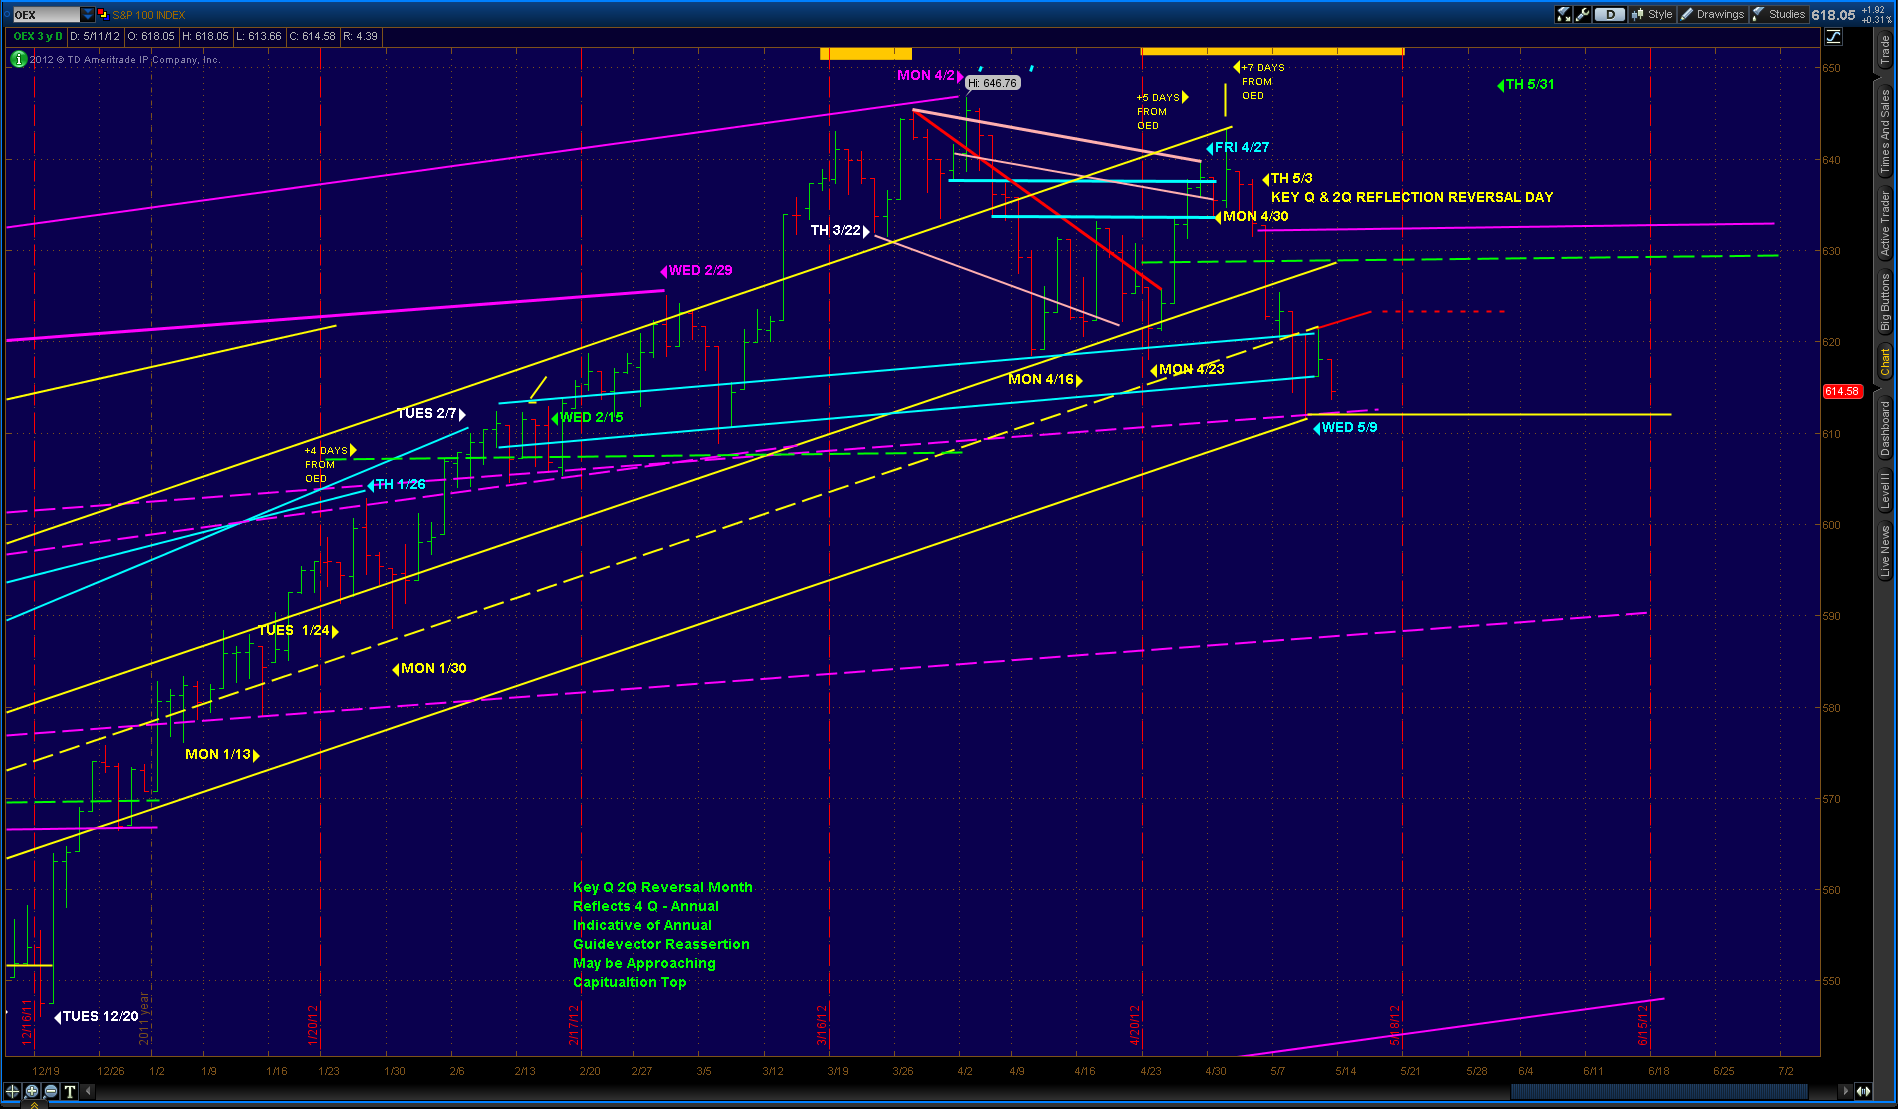
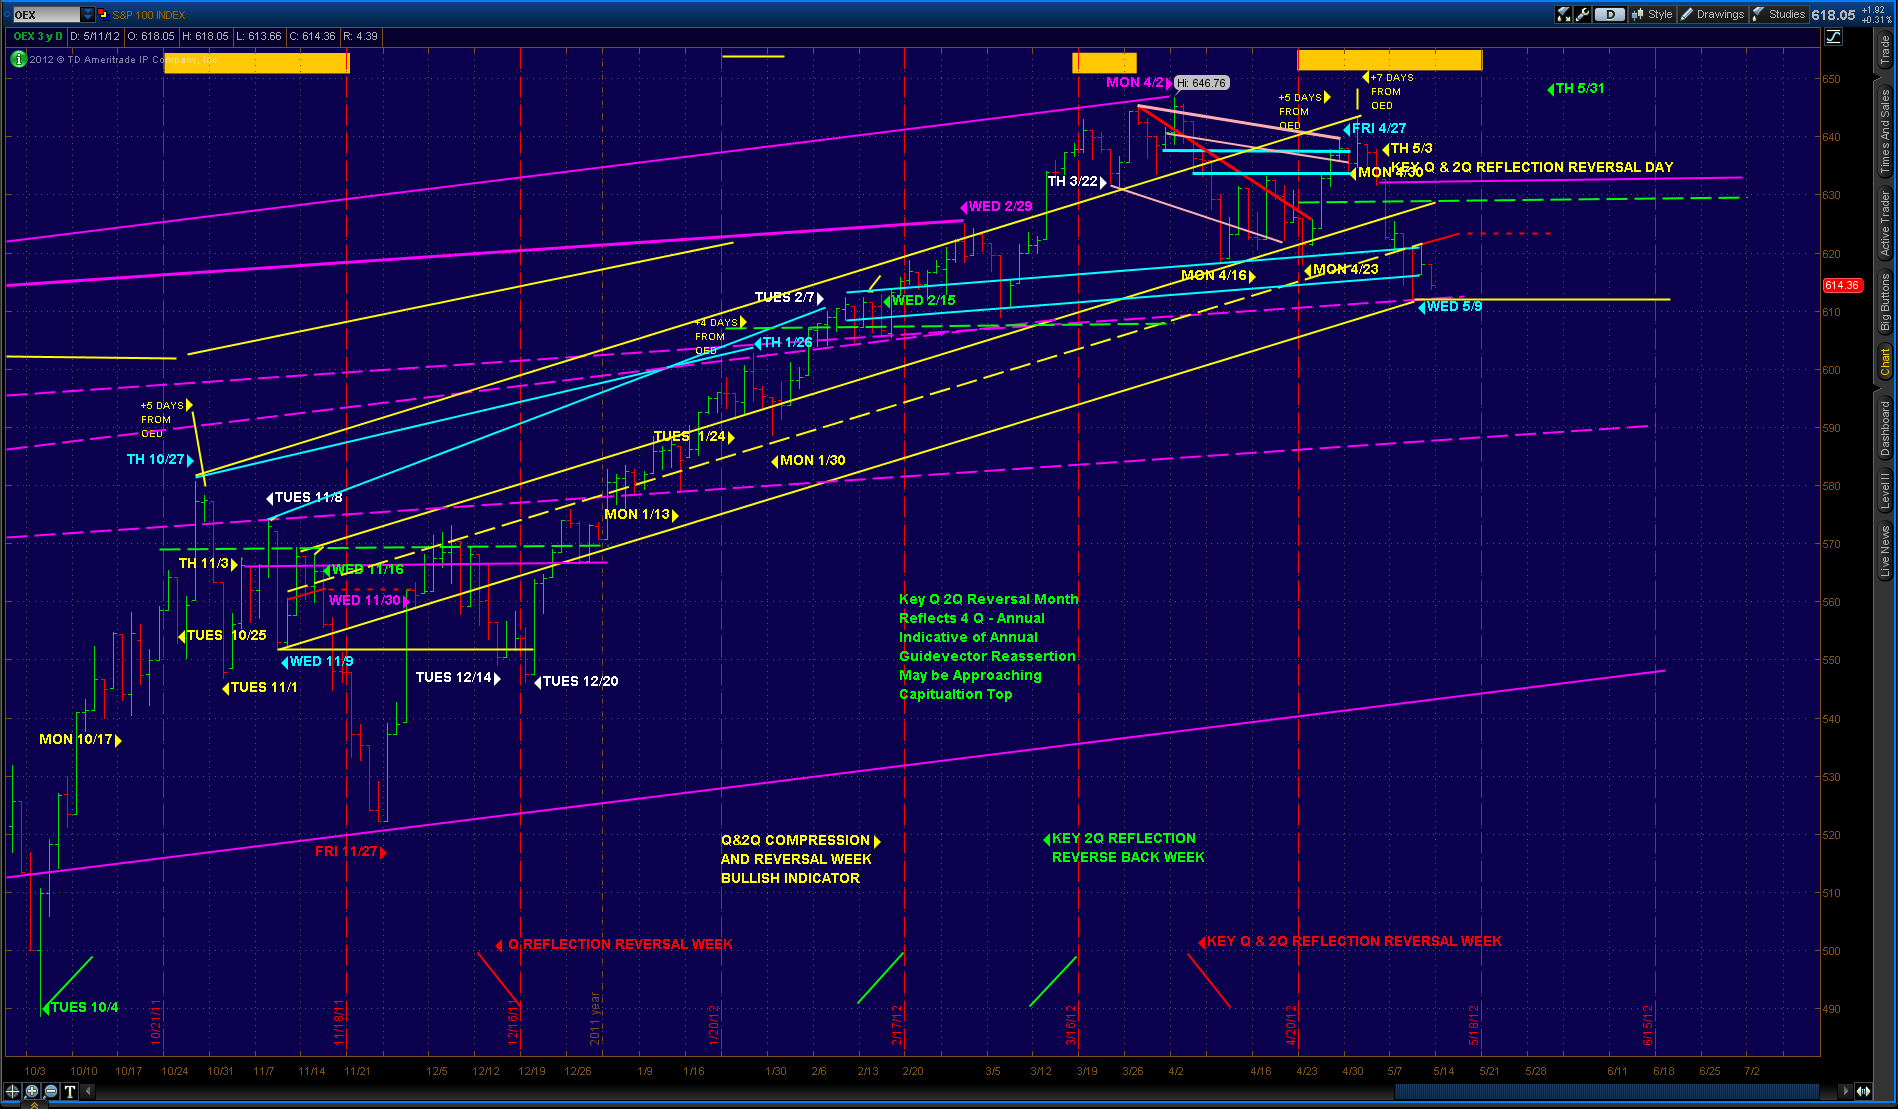
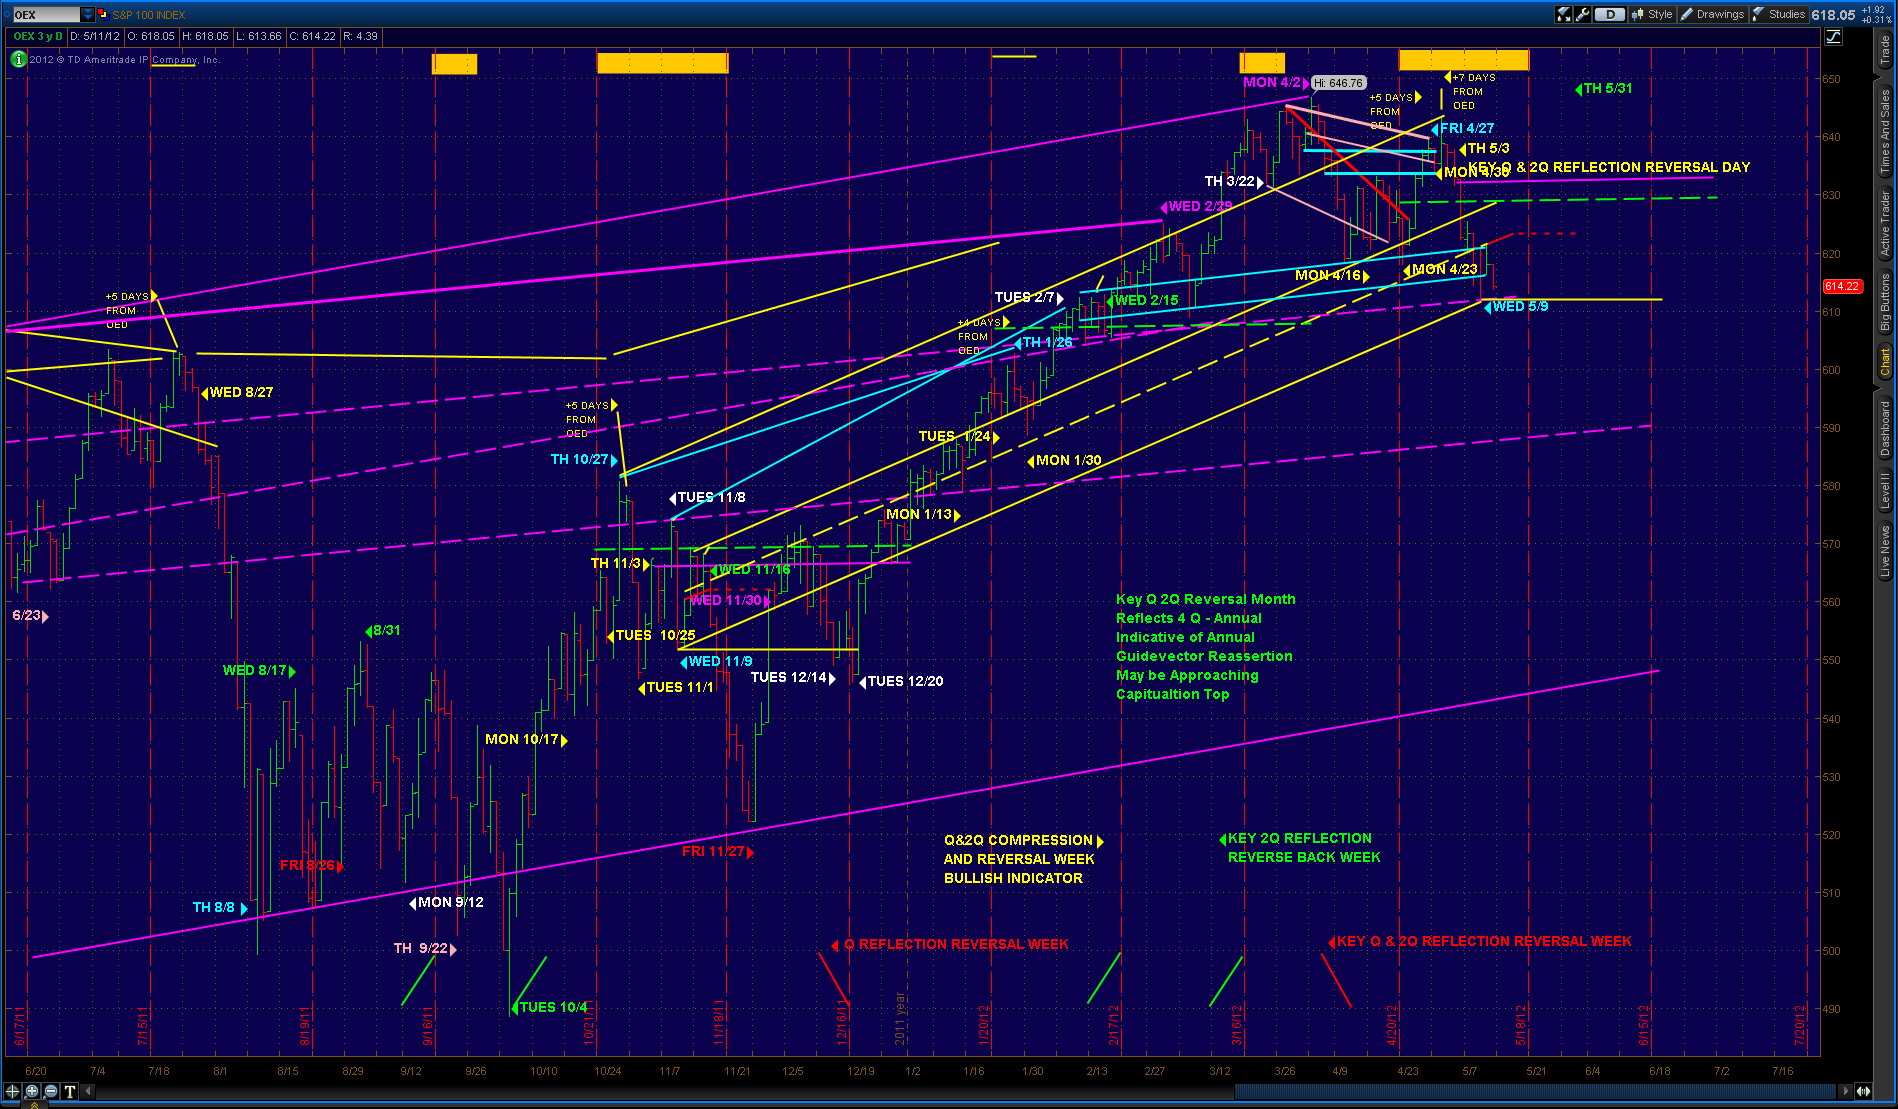
Below is today's chronology of posted Blogs beginning with today's premarket analysis, forecasts, and strategy suggestions, on the SPY and/or the DIA.They utilize the EchoVectorVEST Forecast Analysis and Trade Technology on the Dow 30 Industrials Mini-Futures, the /YM, and the S&P 500 Mini-Futures/ the ES.Blog generation throughout today's trading day presents this ongoing Forecast analysis and its results. A complete account of these posts and issuances follow.This account is highly revealing and educational. The account presents the power and utility of the Forecast Analysis and Trade Technology technique and model utilized and publicly presented.________________________________________________________Chronicle of Today' Analysis and Blogs- Today's Short-Term Outlook And Vector Analysis On The S&P 500Friday May 11, 2012 9:05 AMA Near-Term Vector Analysis of THE S&P 500 Futures FollowsReferring to quarterly, monthly and weekly support and resistance vectors is fundamental to this analysis. Refer to the following charts and narratives accompanying each chart to complete the whole analysis.CHART OF THE MONTHLY ECHOVECTOR, AND THE CURRENT WEEKLY ECHOVECTOR (WITH THREE PRECEDING DAYS WEIGHT ON WEEKLY ECHOVECTOR HIGHLIGHTED).How to read the chart:* Monthly echovector in aquablue (last Friday to Friday a month earlier)* Weekly echovectors in yellow (Friday, today, to prior Friday) and purple (Thursday to prior Thursday) and pink (Tuesday to prior Tuesday) and green (last Monday to prior Monday, with European session highlighted in yellow too)* Current 3 day support vector in peachMONTHLY CHART(click to enlarge)Below is a close-up of the current weekly echovectors at work today provided in the MONTHLY CHART above.The yellow echovector speaks to Friday to Friday coordination and weight. Breaking the yellow spaced resistance vector formed by 7PMThursday evening support would be short term bullish, and could result in tests to the white vector level and possibly, in strong sentiment, test monthly resistance, the upper blue space vector level.Looking at the 90-day, hourly (quarterly echovector) chart for these same values will shed great light on the probabilities in the preceding paragraph.WEEKLY CHART(click to enlarge)Below is the 90 day hourly (quarterly echovector to the hour in light grey) chart.The key base echovector is for yesterday's high, and the 4AM opening in Europe this morning. as you can see, these are coordinate quarterly echovectors. The grey spaced vectors are coordinate forecast vectors extrapolated from the close of last quarter's coordinate Friday (today's quarterly echobackdate,or EBD). The quarterly vector EBD low is also highlighted and the extrapolated echovector shown. These are bias free forecast echovectors.Highlighted also in red spaced vectors are the current quarterly echovectors based on the current weekly lows for this week and the week a quarter ago. The weekly closing echovector and the weekly low and the equivalent of today's quarterly EBD low are shown.These red-space vectors are important vectors within the subtext of a downside bias. Testing these lows on a today would be relatively bearish in bias with respect to next week's trading.However, without bringing bias into the analysis, the QEV forecast echovector indicates modest strength off of opening morning lows.CURRENT STRATEGYLook for a bounce to at least the quarterly EBD unbiased (grey spaced) forecast echovector and possibly to the unbiased 4AM (solid grey) quarterly echovector (QEV EBD FEV). In real strength the market could test the white downvector from last Friday's and yesterdays highs, and even the blue monthly FEV. The latter would be extremely bullish going forward into next week's open and might indicate a short term however tenuous bottom was put in this week.QUARTERLY CHART(click to enlarge)QEV QUARTERLY ECHOVECTOR, TIME COORDINATED.MEV MONTHLYWEV WEEKLYDEV DAILYFEV FORECAST ECHOVECTOR, TIME COORDINATEDEBD ECHOBACKDATEEBP ECHOBACKPOINT, ECHOBACKPRICETPE TIME/PRICE ECHOVECTOR EQUIVALENCYEDP EXTREME DISCRETE PIVOTESTP EXTREME SHORT-TERM PIVOT*AS ALWAYS, Stay nimble, looking for EDPs and ESTPs on DEV and WEV confirming failed (negative-weighted, echo path direction countervailing) TPE extensions, and/or EDPs and ESTPs on DEV and WEV confirming extra-affirming (echo path direction extra-affirming, positive weighted) TPE over extensions.Disclosure: I'm considering going long this morning on the SPY. However, this is a short-term intraday daytrading long____________________________________________________FRIDAY, MAY 11, 2012Original Draft Posted by EchoVectorVest at 8:29 AM PSTCover SPY May 19 136 Call at $1.75 Morning's Price $1.10From Earlier Post"CURRENT STRATEGYLook for a bounce to at least the quarterly EBD unbiased (grey spaced) forecast echovector and possibly to the unbiased 4AM (solid grey) quarterly echovector (QEV EBD FEV). In real strength the market could test the white downvector from last Friday's and yesterdays highs, and even the blue monthly FEV. The latter would be extremely bullish going forward into next week's open and might indicate a short term however tenuous bottom was put in this week.NOWAt 11:29 AM EST: Cover longs.Market price levels have met the monthly blue-line upper forecast resistance echovector, the topside price level (best upper level) of forecasted resistance this morning.Reverse position polarity, utilizing short position (with appropriate stops) to end of day.*AS ALWAYS, Stay nimble, looking for EDPs and ESTPs on DEV and WEV confirming failed (negative-weighted, echo path direction countervailing) TPE extensions, and/or EDPs and ESTPs on DEV and WEV confirming extra-affirming (echo path direction extra-affirming, positive weighted) TPE over extensions.Monthly Resistance Forecast Echovector met in Trading Near European Market Closing TimePosted by EchoVectorVest at 8:29 AM PST_____________________________________________________Key Cycles, Vectors And TradeDates Indicated By The OEX, The S&P100 Large Cap Stock Index.Below is Chart of the S&P 100, the OEX.Before the era of ETFs, the OEX constituted the second most utilized and watched and traded S&P related index.The chart includes key cycles, echovectors, and tradedates (flex points and pivot points) indicated by OEX price action.KEY NOTEThe OEX indicates a solid opening this morning with a potential short -term pivot coming in on Monday's close.OEX: S&P100 ECHOVECTOR CHART WITH KEY CYCLES, WAVES, ECHOVECTORS AND ECHOBACKDATES HIGHLIGHTED(click to enlarge)(click to enlarge)(click to enlarge)(click to enlarge)Disclosure: I am long SPY.Additional disclosure: This is a very short-term intraday long.Themes: spx, iwm market outlook, trading swing trading,forcasting, etfStocks: DIA, QQQ___________________________________________________A Market With Little Conviction Tradng On Weekly And Daily EchoVectors
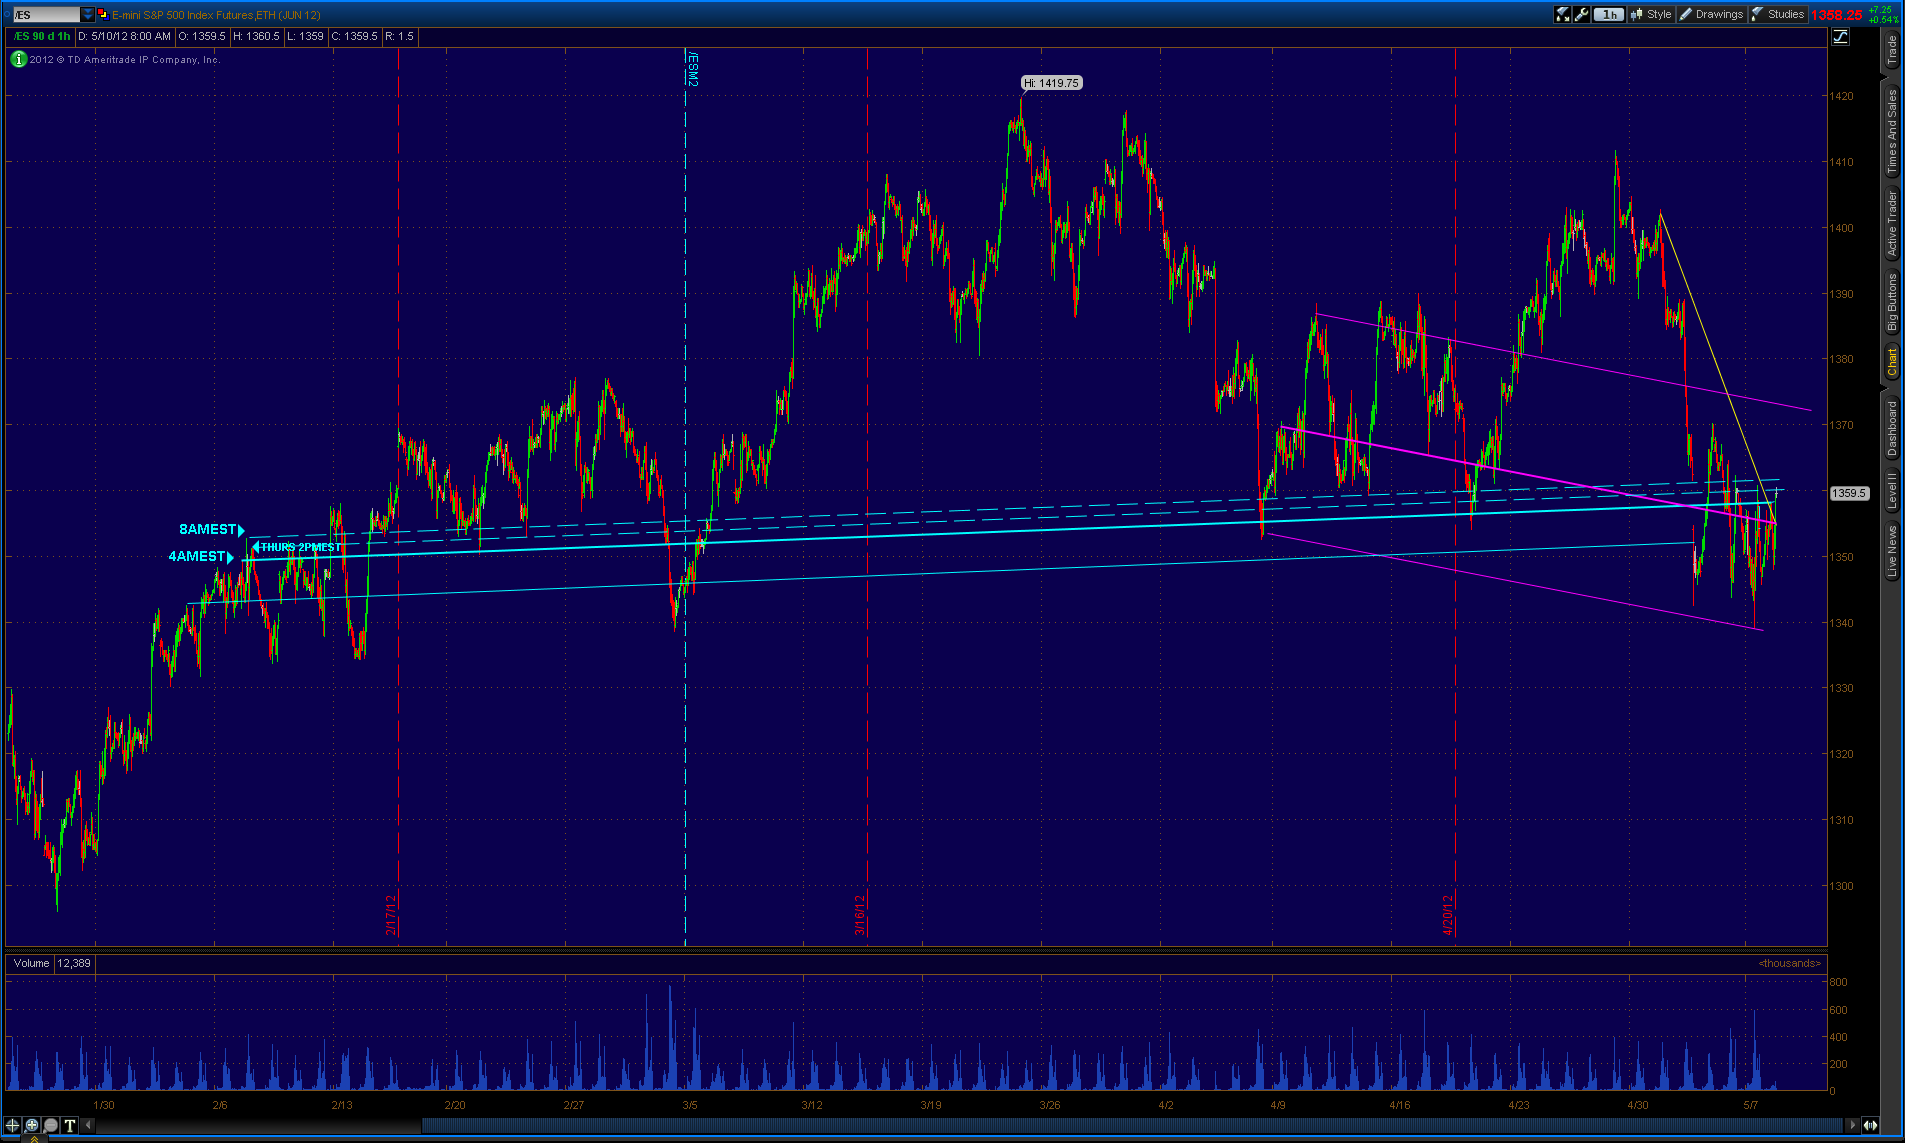
May 11, 2012 3:13 PM EST| about stocks: SPYToday's market is a market with lots of volatility but little conviction,revealed by its tendency to trade on the Daily EchoVector with is also based on the Weekly EchoVector Support Vector Base in formation.This usually means a selldown going into the last hour.See the chart of the /ES for a full illustration of this phenomena(click to enlarge)Disclosure: I am short SPY.Additional disclosure: This is a short-term virtual daytrading positionThemes: S P 500, S P 100 Market Outlook. ETF Stocks: SPY______________________________________________________The Last Hour Of The Last Day Of This Week Of Trading
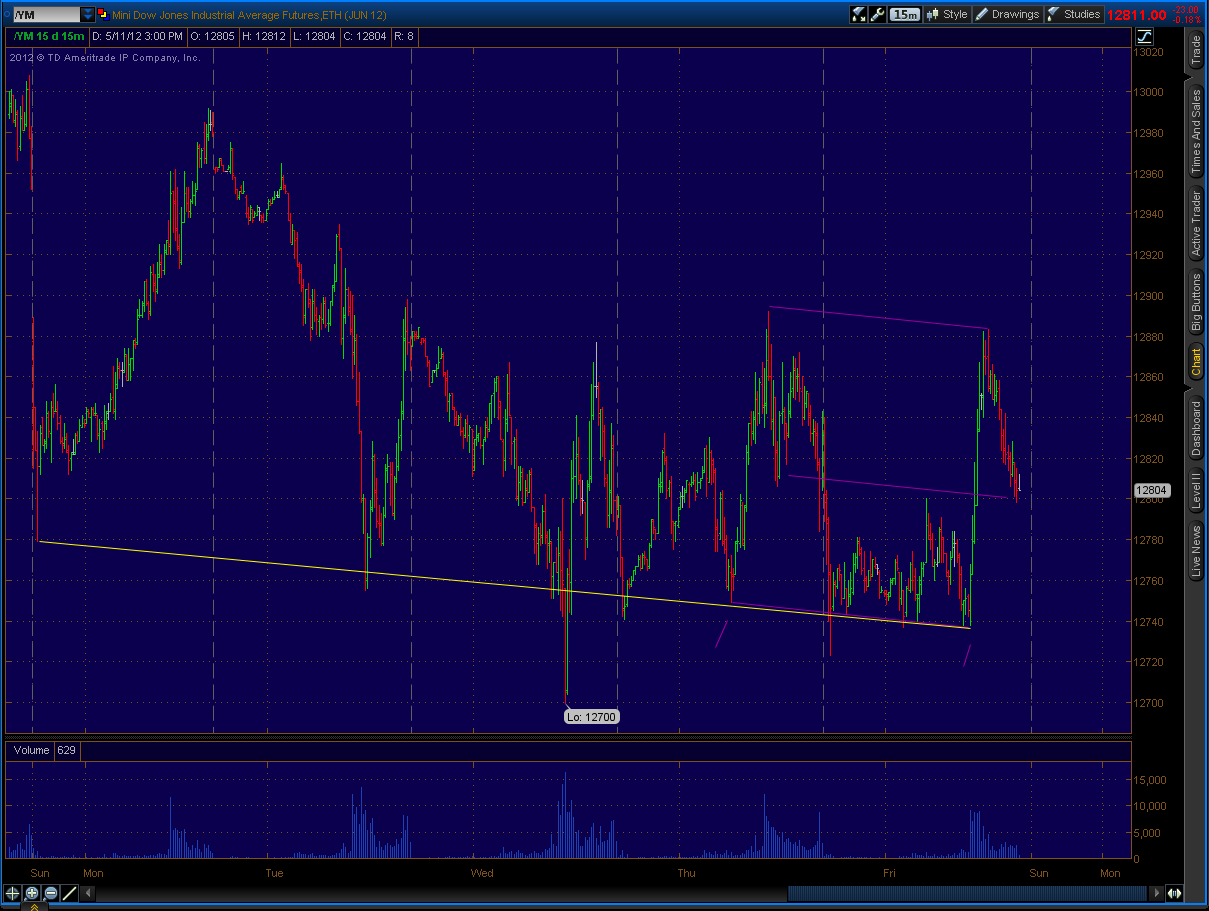
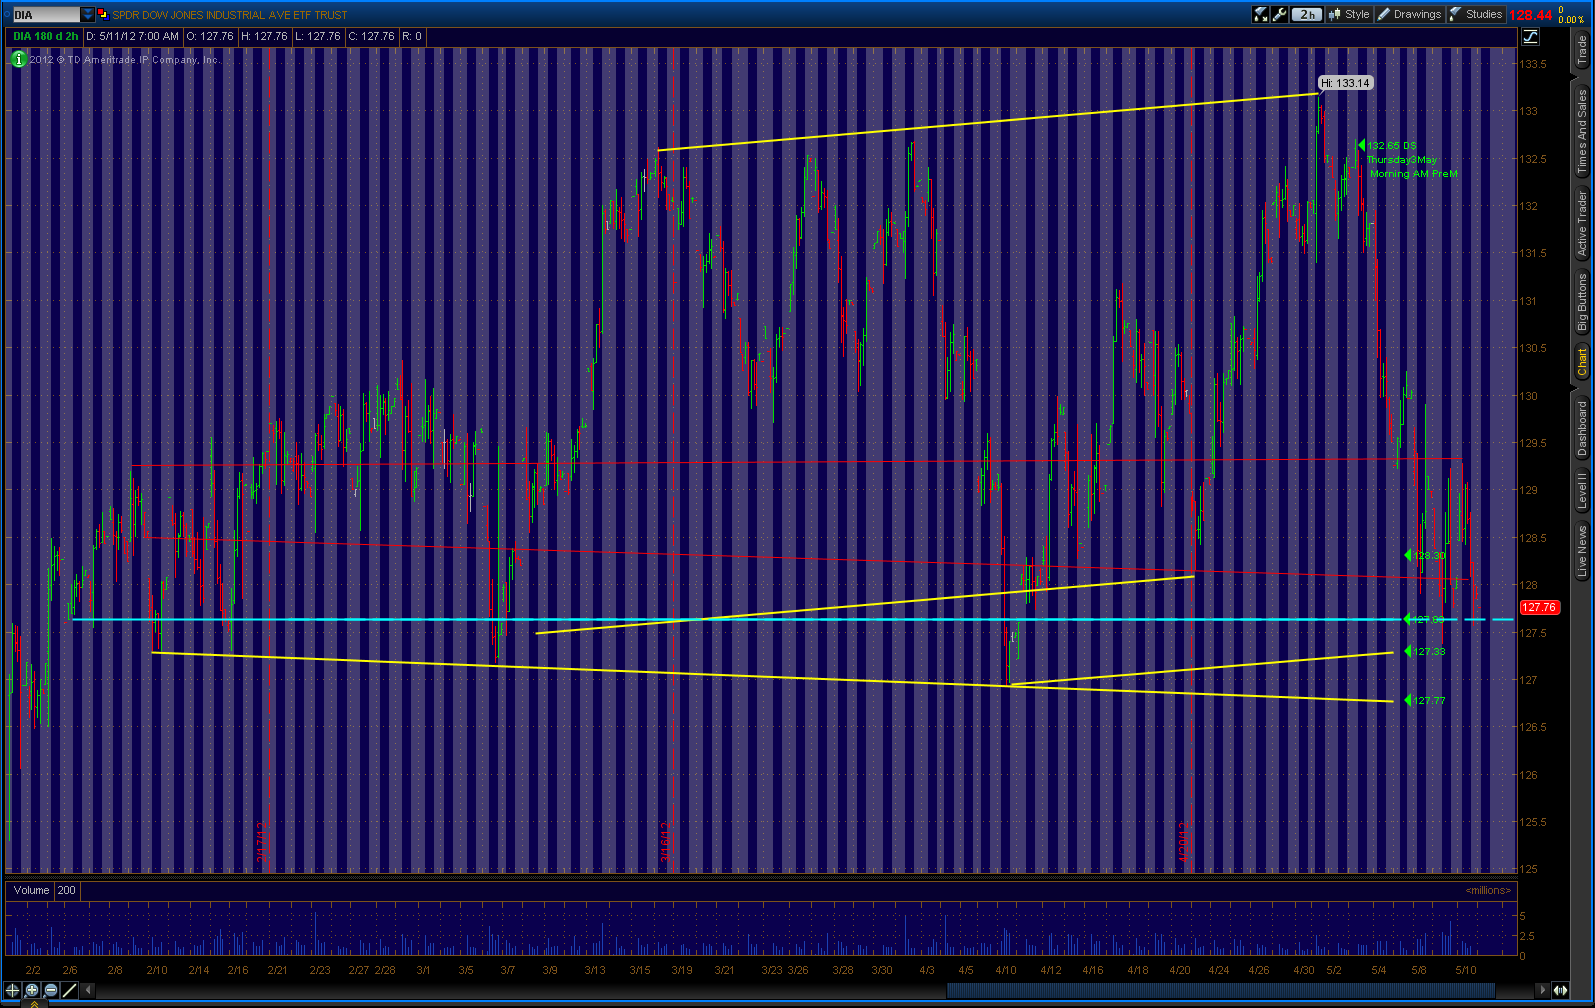
May 11, 2012 3:37 PM ESTThe 4PM potential to the downside is foreshadowed by the following Daily Echovector illustrated in the Dow 30 Industrials Mini-Futures(click to enlarge)Disclosure: I am short SPY.Additional disclosure: temporarilyThemes: dia etf spx market outlook_____________________________________________________The Weekly Baseline Echovectors In Formation And The Daily Echovector Composed Within It Explain Todays Trading Action
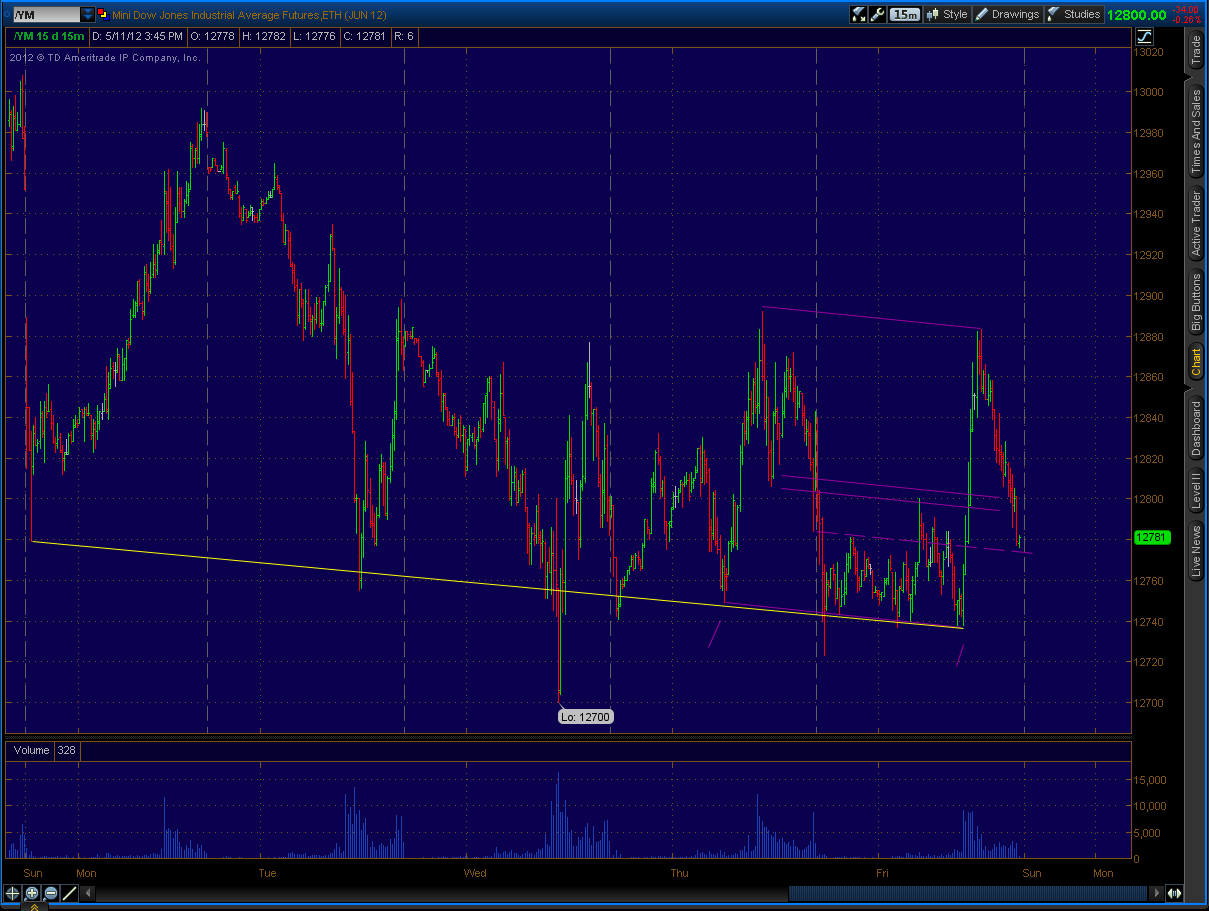
May 11, 2012 3:48 PM ESTBelow is a chart of the /YM, the Dow Industrials Mini-Futures. I displays and illustrates just how today's trading action was determined byThe Weekly Baseline Echovectors In Formation And The Daily Echovector Composed Within It Explain Today's Trading Action.(click to enlarge)Disclosure: I am short SPY.Additional disclosure: This is a virtual short-term daytrading position ready to be closed.Themes: market outlook S P spx_____________________________________________________FRIDAY, MAY 11, 2012Posted by EchoVectorVest at 12:54 PM PSTCover SPY May 19 136 Put from 1130 AM EST opening priceMeeting the Daily Echovector retracement along the Weekly EchoVector baseline currently in formation.(Having reversed open option position polarity at European close and riding put potential to the end of day.)*AS ALWAYS, Stay nimble, looking for EDPs and ESTPs on DEV and WEV confirming failed (negative-weighted, echo path direction countervailing) TPE extensions, and/or EDPs and ESTPs on DEV and WEV confirming extra-affirming (echo path direction extra-affirming, positive weighted) TPE over extensions).Posted by EchoVectorVest at 12:54 PM PST___________________________________________________RECENT ARTICLES______________________________________________________ADDITIONAL BLOGSSPX EchoVector GuideChart: Annual Cycle and Two Year Congressional Cycle With Key Six Month Coordinate Ascention EchoVectorsMay 11, 2012 6:43 AM ESTPresented below is a chart illustrating technical analysis of the SPX, the Standard and Poor's 500 US Large Cap Stock Index. The chart includes annual cycle and congressional cycle coordinate support and resistance vectors, or 'echovectors', and significant coordinate dates or periods in the economic calendar and/or market calendar, or echobackdates.1. Two-year length echovectors are highlighted in blue.2. One year length echovectors are highlighted in yellow.3. Key six month length ascention echovectors are highlighted in peach.4. Key downvectors greater than one quarter 16 weeks) are highlighted in pink and less than one quarter (three weeks) in red.s. Key dates and echobackdates are highlighted in green and red,6. Key equilibrium vectors (horizontal) and channel ranges are highlighted in green and red.7. Significant selloff and equal rally sums (distances) are highlighted in yellow bars.8. Caution periods are highlighted in yellow vertical bars.9. With the exception of the longer solid non one year baseline projection at the bottom of the chart all vectors of the same color are coordinate (parallel).Focused review and analysis of the chart will provide due interpretation.SPX 3 Year Weekly OHLC GuideChart with Key EchoVectors Highlighted(click to enlarge)Disclosure: I am short SPY._____________________________________________________http://seekingalpha.com/instablog/993715-kevin-wilbur/609621-precarious-quarterly-pivot-achieved-in-dow-30-industrialsPRECARIOUS QUARTERLY PIVOT ACHIEVED IN DOW 30 INDUSTRIALS
May 11, 2012 7:37 AM | about stocks: DIAA technically precarious and negatively indicating quarterly pivot was achieved in after hours trading yesterday in the Dow 30 Industrials.This pivot continued in Asian trading but has since moderated in European trading. Should it be reasserted in US premarket trading, this would be a negative outlook indicator.Pivot testing occurrence, though dramatic and negatively implying when they occur, sometimes find support.(click to enlarge)Disclosure: I am long SPY.Themes: dia, djia, spy, spx, S P, S P 500, Market Outlook,Daytrading,Economy, ETF Stocks: DIA______________________________________________________RECENTLY PUBLISHED ARTICLES- May's Stock Market Volatility
on Fri, May 11 • DIA • Comment! - Chart: The XMI And Incredible Price Path Coordination In 2011 And 2012
on Tue, May 8 • DIA, SPY • Comment! - Last Week's Market Reversal And Present Straddle Opportunity
on Mon, May 7 • SPY • Comment! - Chart: The S&P And 'Sell In May' In An Election Year
on Fri, May 4 • SPY • 14 Comment
- May's Stock Market Volatility
____________________________________________________________RELATED POSTS FROM YESTERDAY AND EARLIER THIS WEEK____________________________________________________________SETTING UP THE DAY WITH THE /ESTHURSDAY, MAY 10, 2012 8:23 AM ESTTHE /ES AND SPX AND SPY CURRENT QUARTERLY, MONTHLY, AND WEEKLY ECHOVECTORS FOR THURDAY MORNING, MAY 10, 2012, COORDINATE TO HOUR AT 7:59 AMILLUSTRATION: SPY AND SPX ECHOVECTORS ON CORRELATE/ES CHART BASISHOW TO USE: Look for coordination and/or pivots on the QEV and WEV.NOTE afternoon block QEVFEV PRICE TOP CAP.NOTE Friday QEV EBD weakness and how that effects current Friday morning QEV FEV in current QEV PRESENT HOUR COORDINATE OUTLOOK.(click to enlarge)QEV QUARTERLY ECHOVECTOR, TIME COORDINATED.MEV MONTHLYWEV WEEKLYDEV DAILYFEV FORECAST ECHOVECTOR, TIME COORDINATEDEBD ECHOBACKDATEEBP ECHOBACKPOINT, ECHOBACKPRICETPE TIME/PRICE ECHOVECTOR EQUIVALENCY
EDP EXTREME DISCRETE PIVOT
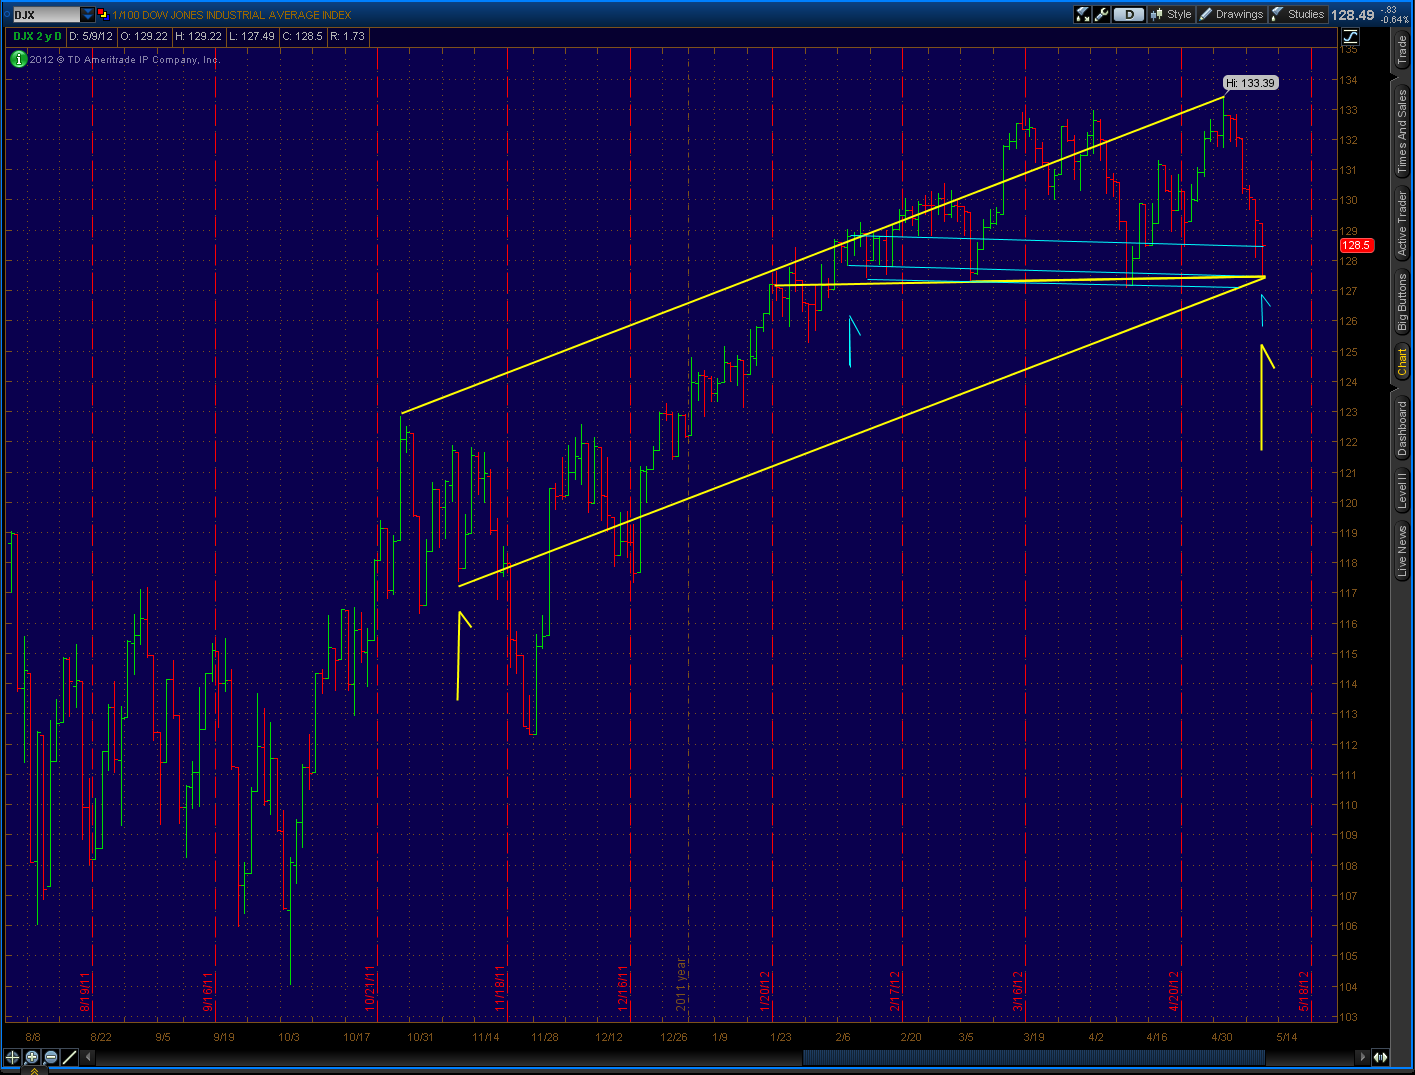
ESTP EXTREME SHORT-TERM PIVOTCURRENT STRATEGY*1 Look for cap this morning and today set by the QEV EBD in morning daily price high and afternoon's ST hourly momentum high.2. Look for short opportunity in afternoon into Friday morning's price low TPE equivalencies on that same basis. Should begin around 2PMEST. Can utilize SPY May 19 2012 Puts if close to strike.*Stay nimble, looking for EDPs and ESTPs on DEV and WEV confirming failed (negative-weighted, echo path direction countervaling) TPE extensions, and/or EDPs and ESTPs on DEV and WEV confirming extra-affirming (echo path direction extra-affirming, positive weighted) TPE overextensions.Disclosure: I have no positions in any stocks mentioned, but may initiate a long position in SPY over the next 72 hours.___________________________________________________________Market Finds Coordination To The Hour On Both 6 Month EchoVector And The 3 Month Echovector Weekly Low EchoChannelMay 9, 2012 12:33 PMDAYTRADER ALERT: DJX DIA DJIAMarket moving to the hour on 6 month echovector.Market right on weekly support track to the day on 3 month key echochannel.Yellow: Bi-quarterlyBlue: QuarterlyDJX, DIA, DJIA Daily OHLC(click to enlarge)_____________________________________________________- WEDNESDAY, MAY 9, 2012
- DIA Daily Chronicle:
- List of ProtectVEST Generated Trade Alerts For DIA ETF for Wednesday 9 May 2012:
- Time-stamped at EchoVectorVEST Blogsite for Issue Confirmation.
- DIA ETF: 11 ISSUES FOR WEDNESDAY 9 MAY 2011
(LAST TO FIRST, PST) - MODEL Generates $15.18 PER SHARE GAIN RESULT IN 1 DAYIN 11 COMPREHENSIVE REAL TIME TRADE ISSUES THROUGH DAY_________________________________________________________________________________On $50K base account with X4 SEC DTBP The Gross Capital Gain Capture from 11 DIA ETF Issues Generated on $129 price per share base is $200K / $129 = 1550 shares time $15.18 per share =$23,535 = 47% of $50K base and $11.75% of $200K non-leveraged cash base.
_________________________________________________________________________________d.23DIA: ADJUST to $128.23 from $128.35 DIA ETF...
EchoVectorVest
12:59:00
ADJUST to $128.23 from $128.35 DIA ETF PEB ProtectVEST OOTVTAPS for US Major Large Cap Composite Stock Indexes on Wednesday 8 May 2012
Key Active dia etf peb* ootvtaps fnpi, fnpdl, fnpds 3-Leg was adjusted for major market stock composites. (It is currently active and positive on the Double short Leg.)
Adjust to $128.23 DIA ETF PEG LB DV OOTVTAPS ufn
+.12x2=.24
___________________________________________dia .35 taps 3l aDIA: to $128.35 from $129.68 D...
EchoVectorVest
12:54:00
DIA: Adjust to $128.35 from $129.68 DIA ETF PEB ProtectVEST OOTVTAPS for US Major Large Cap Composite Stock Indexes on Wednesday 8 May 2012
Key Active dia etf peb* ootvtaps fnpi, fnpdl, fnpds 3-Leg was adjusted for major market stock composites. (It is currently active and positive on the Double Short Leg.)
Adjust to $128.35 DIA ETF PEG LB DV OOTVTAPS ufn
+.33x2.=.66
____________________________________________dia .68 otaps DIA: ADJUST to $128.68 from $128.2...
EchoVectorVest
12:41:00
DIA: ADJUST to $128.68 from $128.24 DIA ETF PEB ProtectVEST OOTVTAPS for US Major Large Cap Composite Stock Indexes on Wednesday 8 May 2012
Key Active dia etf peb* ootvtaps fnpi, fnpdl, fnpds 3-Leg was adjusted for major market stock composites. (It is currently active and positive on the Double Long Leg.)
Adjust to $128..68 DIA ETF PEG LB DV OOTVTAPS ufn
+.42x2=.82
__________________________________________dia otaps .24 3l DIA: ADJUST to $128.24 from $1...
EchoVectorVest
12:15:00
DIA: ADJUST to $128.24 from $129.39 DIA ETF PEB ProtectVEST OOTVTAPS for US Major Large Cap Composite Stock Indexes on Wednesday 8 May 2012
Key Active dia etf peb* ootvtaps fnpi, fnpdl, fnpds 3-Leg was adjusted for major market stock composites. (It is currently active and positive on the Double short Leg.)
Adjust to $128.24 DIA ETF PEG LB DV OOTVTAPS ufn
+.15x2.=.30
____________________________________________dia otaps 3l 128.39 DIA: ADJUST to $128.39 from ...
EchoVectorVest
12:01:00
DIA: ADJUST to $128.39 from $129.01 DIA ETF PEB ProtectVEST OOTVTAPS for US Major Large Cap Composite Stock Indexes on Wednesday 8 May 2012
Key Active dia etf peb* ootvtaps fnpi, fnpdl, fnpds 3-Leg was adjusted for major market stock composites. (It is currently active and positive on the Double Short Leg.)
Adjust to $128.39 DIA ETF PEG LB DV OOTVTAPS ufn
+.61x2.=1.22
___________________________________________dia otaps a $129.01 3l DIA: ADJUST to $129.01 fr...
EchoVectorVest
10:43:00
DIA: ADJUST to $129.01 from $128.20 DIA ETF PEB ProtectVEST OOTVTAPS for US Major Large Cap Composite Stock Indexes on Wednesday 8 May 2012
Key Active dia etf peb* ootvtaps fnpi, fnpdl, fnpds 3-Leg was adjusted for major market stock composites. (It is currently active and positive on the Double Long Leg.)
Adjust to $129.01 DIA ETF PEG LB DV OOTVTAPS ufn
+.81x2=1.64
_____________________________________________DIA: ADJUST to $128.20 from $127.60 DIA ETF PEB Pr...
EchoVectorVest
09:48:00
DIA: ADJUST to $128.20 from $127.60 DIA ETF PEB ProtectVEST OOTVTAPS for US Major Large Cap Composite Stock Indexes on Wednesday 8 May 2012
Key Active dia etf peb* ootvtaps fnpi, fnpdl, fnpds 3-Leg was adjusted major market stock composites. (It is currently active and positive on the Double Long Leg.)
Adjust to $128.20 DIA ETF PEG LB DV OOTVTAPS ufn
+.60x2=1.20
_________________________________________________DIA: ADJUST to $128.60 from $127.50 DIA ETF PEB Pr...
EchoVectorVest
09:35:00
DIA: ADJUST to $128.60 from $127.50 DIA ETF PEB ProtectVEST OOTVTAPS for US Major Large Cap Composite Stock Indexes on Wednesday 8 May 2012
Key Active dia etf peb* ootvtaps fnpi, fnpdl, fnpds 3-Leg was adjusted major market stock composites. (It is currently active and positive on the Double Long Leg.)
Adjust to $128.60 DIA ETF PEG LB DV OOTVTAPS ufn
+1.10x2 = 2.20
___________________________________________________DIA: ADJUST to $127.50 from $127.90 DIA ETF PEB Pr...
EchoVectorVest
07:28:00
DIA: ADJUST to $127.50 from $127.90 DIA ETF PEB ProtectVEST OOTVTAPS for US Major Large Cap Composite Stock Indexes
Key Active dia etf peb* ootvtaps fnpi, fnpdl, fnpds 3-Leg was adjusted major market stock composites. (It is currently active and positive on the Double Short Leg.)
Adjust to $127.50 DIA ETF PEG LB DV OOTVTAPS for Wednesday 5/9/2012 ufn
+.40x2=.80
______________________________________________DIA: ADJUST to $127.90 from $128.15 DIA ETF PEB Pr...
EchoVectorVest
05:55:00
DIA: ADJUST to $127.90 from $128.15 DIA ETF PEB ProtectVEST OOTVTAPS for US Major Large Cap Composite Stock Indexes
Key Active dia etf peb* ootvtaps fnpi, fnpdl, fnpds 3-Leg was adjusted for major market stock composites. (It is currently active and positive on the Double Short Leg.)
Adjust to $127.90 DIA ETF PEG LB DV OOTVTAPS ufn
+1.25x2.=2.50
__________________________________________________DIA: ADJUST to $128.15 from $129.25 DIA ETF PEB Pr...4View count05:16:00DIA: ADJUST to $128.15 from $129.25 DIA ETF PEB ProtectVEST OOTVTAPS for US Major Large Cap Composite Stock IndexesKey Active dia etf peb* ootvtaps fnpi, fnpdl, fnpds 3-Leg was adjusted major market stock composites. (It is currently active and positive on the Double Short Leg.)Adjust to $128.15 DIA ETF PEG LB DV OOTVTAPS for Wednesday 5/9/2012 am premarket ufn+1.10x2 =2.20_______________________________________________TUESDAY, MAY 1, 2012
ProtectVEST 2012 MAJOR ALERTS ISSUED: DIA, SPY, and USO
MAJOR ALERTS ISSUED FOR BOTH
(1) THE MAJOR MARKET IN LARGE CAP US STOCKS: THE DIA, SPY, AND QQQ
(2) THE MAJOR MARKET IN LIGHT SWEET CRUDE OIL: THE USO
1. THE MAJOR MARKET ALERT FOR THE LARGE CAP US STOCK MARKET
DIA ETF PEB ALERT FOR THE DIA, SPY, AND QQQ
Key Active dia etf peb ootvtaps was $131.75 3 leg fnpi fnpds fnpdl in force, and reset to$132.65 for major market stock composites. (It is currently active and positive on the Double Long Leg.)
Fully Cover Full Net Portfolio Position with Insurance
Major Double to Quad Short Opportunity in the USO
Use May 19 2012 140 SPY Puts for Alternative Double/Quad Short Opportunity Positioning (SPY *PEB)
Stay Nimble. UFN (Until Further Notice)
*PEB Price Equivalency Basis. Use for SPX, SPY, and NDX, QQQ, Timing and Action Equivalencies
2. THE MAJOR ALERT FOR THE LIGHT SWEET CRUDE OIL MARKET
USO ETF ALERT
Fully Cover Full Net Stock Position with Insurance
Major Double to Quad Short Opportunity in the USO
USE USO May 19 2012 38 to 40 Puts for Alternative Double/Quad Short Opportunity Positioning
Stay Nimble. UFN (Until Further Notice)
See RELATED Posts and Charts on SPX and USO Below
SPX CHART:
GuideChart Illustrating The "Sell In May And Go Away!" Wall Street Phenomena And The Subsequent Stock Market Composite Price Level Drop In Presidential And Congressional Election Years.Provided below is a graphical display of the professionally favored and broadly watch Large Cap Stock Market Index, the $SPX.The SPX is the favored index, and "general stock market measure" used by professional analyst and investment managers both domestically and globally. It is held as the predominate and most representative measure of the US Large Cap Securities Market.Presented below is a GuideChart of the SPX which illustrates the effects of the (1) Presidential Election Cycle and the (2) Congressional Election Cycle on the price level of the SPX.In this illustration, I am focusing particularly on the effect of the old Wall Street adage "Sell in May and Go Away", and how this adage is (1) illustratively pronounced in Presidential Election Cycle years and Congressional Cycle Years, and (2) how it can lead to the start of, and cascade into a precipitous and major Stock Market selloff's in Regime Change Cycle Election years (which are usually every eight years, but can occur, post facto, in four years as well.)Also illustrated is how immediately preceding annual echovector cycles can also foreshadow the May selloff (see the May 2011 and May 2010 echovectors highlighted in beige)READING SPX GUIDECHART:1. Click on the Chart and then Click again to both enlarge and zoom the chart. Use your optimum display settings also.2. The SPX GuideChart is a 10-Year Weekly OHLC (Open/High/Low/Close) Price Bar chart3. The Congressional Election Cycle is displayed in alternate yellow and agua-blue vectors, in order to discern every two years along the chart from the key First Trading Week of May bar and its high price more clearly.4. The selloff from the first week of May to the traditional 2ND or 3RD Week of August is displayed with a red vector. The white bars located under Congressional Cycle or located on the weekly OHLC (Open/High/Low/Close) price bar line also display these annual sell-off sums.5. In solid green are the correlate dates of the weekly bars beginning the selloff the first trading week in May for the cycle years.6. In solid red are the correlate dates of the weekly bars completing the selloff sum at that time. Notice that in many cycle years 'lower lows' are achieved before this date.7. The horizontal solid pink line illustrates how the SPX has achieved the nearly perfect correlate price level to May four years earlier, on aweekly closing price basis. This is often referred to as a resistance price levelvector (with respect to the expressed specific time quantity (in this case, being four years).8. The eight-year long dotted-green lines represent key price vectors and ascending price channels identified by EchoVectorVEST MDPP.9. Notice the magnitude of the selloff from (1) the first week in May of Regime Change Cycle Election year, or, (2) as measured from its preceding year's summer price high.We hope this chart helps demonstrate the prudence of applying price level insurance to major market funds and ETFS. These funds and ETFs typically comprise a large portion of overall portfolio exposure existing under passive professional management regiments and affiliations.The historical reward-to-risk ratio of proceeding beyond THE FIRST WEEK OF MAY without 'major stock market exposed' portfolio price level 'insurance' applications, or proceeding to just continue along within 'full uninsured passive portfolio management portfolio exposures', would seem imprudent and potentially counter-productive to overall accrued, and time-already-spent-earned, portfolio value.In the present era of active and advance financial management and financial position and holdings value optimization techniques, better price protection strategies and portfolio management and portfolio value enhancement opportunities are available.____________________________________________________SPX 10-Year Weekly OHLC GuideChart(click to enlarge)Disclosure: I am short SPY.Themes: QQQ, $RUT, IWM, $DJIA, $OEX, $XMI, ETF, Composite Indexes, Stock Market Outlook, Market Analysis, Technical Analysis,Cyclical Analysis, Price Analysis Stocks: SPY, DIA____________________________________________________
A Current USO ETF EchoVector And EchoBackDate Price Analysis: Is Seasonal Price History Unfolding Again?
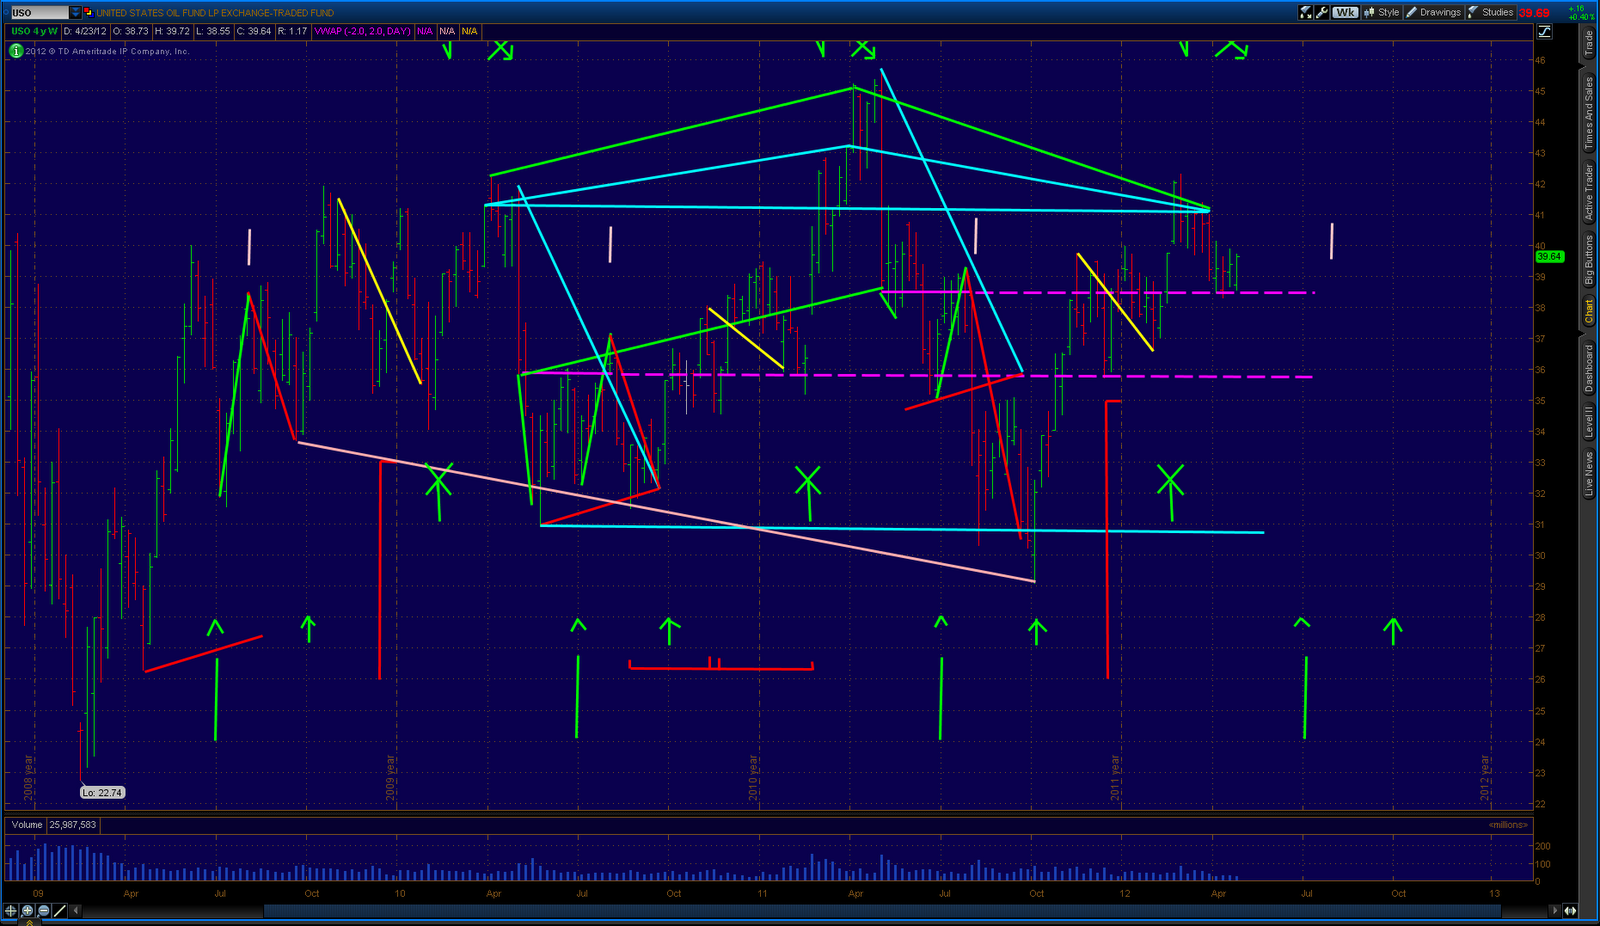
Apr 30, 2012 11:03 PMA Current USO ETF EchoVector And EchoBackDate Price Analysis: Is Seasonal Price History Unfolding Again?April 29, 2012 2:35 PMRecently there has been a tremendous amount of interest and much media attention given to the energy markets, and particularly to the markets for crude oil and gasoline.The seasonal February-through-April 'price strength period' unfolded and manifested itself once again this year, and with usual its usual price vigor.Provided below is a chart with an excellent graphical illustration of this year's 'price seasonalities' in the USO ETF.Also shown and marked on the chart are the many regular and repeating annual price 'ebbs and flows' experienced in the USO ETF the last several years.A close examination of the chart may significantly aid the portfolio manager, and the trader, in their management of USO ETF positions, analysis, and reasoned forecasts, and perhaps also with other USO-related ETF's and commodity futures and indexes. Especially if their analysis includes or emphasizes seasonal and historical conditions and price patterns... and relevant echovectors.Following the USO ETF price chart below I have listed some 'suggestive analytical perspectives', and some key 'notes of interest'.Upon review of this chart and its technical indications, prepared caution in the near-term regarding the USO ETF's present price level, and going forward the next several weeks, may well be in order.USO ETF Chart4-Year Weekly OHLC ChartWith Key Active Annual EchoVectors And Annual EchoBackWeeks's Highlighted:(Click on chart and click again to enlarge and zoom)On Chart Above: Suggestive Analytics and Key Notes of Interest:1. Be aware of month 4 in the Annual and Bi-Annual Cycles2. Note first 3 weeks of month 5.3. Note the 'price level low' of the first week of May, and how it proves to be 'around top or close to sell-down price level,' occurring at end of July and beginning of August's 'mid-2/-3rd week's summer top.'4. Be aware of momentum reversal at the end of September and the beginning of October, after downside price consolidation.5. Be aware of the 'about one quarter earlier in time' momentum bottom occurring at the end of June/early July. Note that reversal is good for first month, of three subsequent months, leading to October, and failing around beginning of August. This forms a cone with June/July and September/October bottoms with an August 'pointed top'.6. In our view, these are significant seasonal relative strength reversal periods and indicators. EchoVectors and EchoVector EchoBackDates are significant in the analysis, forecast, and current price and price level measurements here.7. Note the importance of week 6 low and the week 9 high, and sell-off from week 9 to week 11, in the 'Winter Quarter EchoVector (following the prior fall and summer quarterly weekly High and Low weekly momentum pattern deltas, within a quarterly and bi-quarterly echovector and echobackvector analysis, focusing on key echobackweek highs and lows.Within your own working analytic frame, retopologize the 3-Year OHLC daily price action charts for further definition and precision revelation, and then retopologize those further to 'hourly intra-day and further discrete price action for even further 'resolution and revelation'. Then overlay this data with regular announcement schedule information, special inventory and/or production announcement information occurrences, and further with related macro-event impacting announcements... all for increased and even further definition, forecast, and management insight and effectiveness.Disclosure: I am short USO.Themes: etf-analysis
Back To Kevin Wilbur's Instablog HomePage »
Instablogs are blogs which are instantly set up and networked within the Seeking Alpha community. Instablog posts are not selected, edited or screened by Seeking Alpha editors, in contrast to contributors' articles.
_____________________________________________________________________
Current USO ETF Trader's Edge EasyGuideChart By ProtectVEST And AdvanceVEST, EchoVectorVEST, MDPP
April 27, 2012Current USO ETF EchoVector and EchoBackDate Price Analysis: by ProtectVEST and AdvanceVEST by EchoVectorVESTThere has been a tremendous amount of interest and much media attention given to the energy markets recently, particularly to to the market prices of crude oil and gasoline. The 'seasonal' February through April price strength period has manifested itself yet once again this year with vigor.Provided below is an excellent graphical illustration of this year's price seasonality, and much more. Provided also is a significant graphical illustration of the many regular annual price 'ebbs and flows' experienced in the USO ETF the last several years.A close examination of the chart below can significantly aid the portfolio manager and the trader in the management of their market position analysis and responsibilities and their resasonable forecasts in the USO ETF, and related ETF's, and commodity futures, and indexes with an emphasis on seasonal and historical conditions and historical price patterns... and echovectors.Key notes of interest and suggestive analysis are presented below the chart.ProtectVEST and AdvanceVEST by EchoVectorVESTDivisions of Motion Dynamics and Precision PivotsBradford Market Research and Analytics"We're keeping watch for you!"USO ETFTrader's Edge Master EasyGuideChart4-Year Weekly OHLC ChartWith Key Active Annual EchoVectors And Annual EchoBackWeeks's Highlighted:EchoBackWeeksEchoBackDatesEchoBackPointsEchoBackPeriods, andEchoVectors On Chart Above:1. Be aware of monh 4 in the Annual and Bi-Annual Cycles2. Note first 3 weeks of month 5.3. Note the 'price level low' of the first week of May, and how it proves to be 'around top or close to sell-down price level,' occuring at end of July and beginning of August's 'mid-2/-3rd week's summer top.'4. Be aware of momentum reversal at the end of September and the beginning of October, after downside price consolidation.5. Be aware of the 'about one quarter earlier in time' momentum bottom occuring at the end of June/early July. Note that reversal is good for first month, of three subsequent months, leading to October, and failing around beginning of August. This forms a cone with June/July and Sept/Oct bottoms with an August 'pointed top'.6. In our view, these are significant seasonal relative strength reversal periods and indicators. EchoVectors and EchoVector EchoBackDates are significant in the analysis, forecast, and current price and price level measurements here.7. Note the importance of week 6 low and the week 9 high, and sell-off from week 9 to week 11, in the Winter EchoVector Quarter (following the prior fall and summer quarterly weekly High and Low weekly momentum pattern deltas, withinin a quarterly and bi-quarterly echovector and echobackvector analysis, focusing on key EchoBackWeek highs and lows.Within your own working analytic frame, re-topologize the 3 -Year OHLC daily price action charts for further definition and precision revelation, and then re-topologize those further to 'hourly intra-day and further discrete price action for even further 'resolution and revelation'. Then overlay this data with regular announcement schedule information, special inventory and/or production announcement information occurances, and further with related macro-event impacting announcements... all for increased and even further definition, forecast, and management insight and effectiveness.See www.EchoVectorVEST.Blogspot.comwww.echovectorvest.comwww.motiondynamicsandprecisionpivots.comProtectVEST and AdvanceVEST by EchoVectorVESTDivisions of Motion Dynamics and Precision PivotsBradford Market Research and Analytics"We're keeping watch for you!"
Themes: DIA, DJX DJIA, SPY, SPX, S$P S P 500, QQQ, NDX, OEX, S P 100, XMI, MMI, Major Market Index, IWM, Russell 2000, ETF, ETF Analysis, Major Market Large Cap Composite Indexes, Stock Market Outlook, Market Analysis, Technical Analysis, Cyclical Analysis, PricStocks: SPY, DIA- Today's Short-Term Outlook And Vector Analysis On The S&P 500


Back To Kevin Wilbur's Instablog HomePage »
Instablogs are blogs which are instantly set up and networked within the Seeking Alpha community. Instablog posts are not selected, edited or screened by Seeking Alpha editors, in contrast to contributors' articles.

No comments:
Post a Comment
Note: Only a member of this blog may post a comment.