


Today's EchoVector Pivot Point Chart And Analysis: Silver: From Sunday March 2, 2014
FRAMECHART UPDATES: Wednesday, March 5, 2014


MDPP PREMIUM DESK PARTIAL RELEASE TO FREE ONLINE MARKET ALPHA BRAND NEWSLETTER GROUP BY BRIGHTHOUSE PUBLISHING AND TO SEEKINGALPHA.COM
FOR FURTHER AND MOST RECENT AND TIMELY FREE ONLINE PUBLIC RELEASE UPDATES SEE
AND
RSS FEEDS AVAILABLE
DIRECT LINKS TO NEWSLETTERS GROUP SELECT ARTICLES AND POSTS

FOR FURTHER AND MOST RECENT AND TIMELY FREE ONLINE PUBLIC RELEASE UPDATES SEE
AND
RSS FEEDS AVAILABLE
DIRECT LINKS TO NEWSLETTERS GROUP SELECT ARTICLES AND POSTS
SILVERPIVOTS.COM & GOLDPIVOTS.COM & ETFPIVOTS.COM & COMMODITYPIVOTS.COM & MARKET-PIVOTS.COM

___________________________________________________________________________
PRIOR PREMIUM POST RELEASES TO MARKET ALPHA BRAND NEWSLETTERS FOR ADDITIONAL CONTEXT
Today's EchoVector Pivot Point Chart And Analysis: Silver

In this regard, today is a very timely day for a review of the annual silver price chart from an EchoVector Price Analysis Perspective for the occurrence of possible annual price symmetries that may be forming, and these formation's trading implications.
In this analysis I will focus on a daily action price chart of the SLV ETF as our price chart proxy for silver metals market price action.
(Left click on image of chart to open image in new tab. Right click on image opened in new tab to further zoom EchoVector Analysis chart image illustrations and highlights.)
Looking at the chart above, we can see a very significant symmetry emerging in the key active echovector running from the 2012 price low echo-back-date on Thursday, June 28TH, to its 2013 counterpart low on Thursday, June 27, and in the corresponding active echovector -- with its parallel momentum -- running from the period of March 1ST, 2013, to March 1ST of this year.
Looking at this past week and the yellow forward tradebox highlighted we find a key corresponding tradebox in place last year in the same period.
The trade price box that followed March 1ST last year, highlighted in yellow, appears to be setting up again this year. It runs from the beginning of March until silver's price 'broke down' last March 28TH. This year's set up is currently in remarkable coordination with last year's key active annual momentum echovector established from the 2012 and 2013 summer lows.
This detected echovector price symmetry represents a potentially interesting swing trade assessment starting this week, which goes forward to the end of March.
Price strength in this yellow box that counters last year's activity, and in the several weeks that follow, or silver just holding up in this price box equivalent level through mid-April, could produce major upside counterclockwise pivot pressure in the annual echovector and propel SLV easily up to the $24 range and possibly to the $26-$27 range before the year is over. This is the bullish scenario. However, this scenario would require some relatively heavy lifting support during the coming otherwise cyclically difficult spring quarter.
Thanks. And good luck in your silver investing and trading!
Disclosure: I have no positions in any stocks mentioned, and no plans to initiate any positions within the next 72 hours. I wrote this article myself, and it expresses my own opinions. I am not receiving compensation for it. I have no business relationship with any company whose stock is mentioned in this article.
Kevin John Bradford Wilbur is the Chief Market Strategist and Senior EchoVector Analysis Methodologist at PROTECTVEST AND ADVANCEVEST. He is a prize-winning Economist and Financial Physicist with an over 35 year span of experience and awards in Academics, Research, Management, Practice and Trade. Kevin has specialized experience in the Major Market Indexes, Commodities, ETFs, and in derivatives and the derivatives markets.
Search market pivots to read more about Kevin John Bradford Wilbur and his specialty,and about THE MARKET ALPHA BRAND NEWSLETTER GROUP..
Search market pivots to read more about Kevin John Bradford Wilbur and his specialty,and about THE MARKET ALPHA BRAND NEWSLETTER GROUP..
This article is tagged with: Gold & Precious Metals
ECHOVECTOR CYCLE LENGTH COLOR CODE GUIDE:
4-Year Presidential Cycle EchoVectors: White
2-Year Congressional Cycle EchoVectors: Yellow
1-Year Annual Cycle EchoVectors: White or Red
6-Month Bi-Quarterly Cycle EchoVectors: Yellow
3-Month Quarterly Cycle EchoVectors: White
OTAPS-PPS Position Polarity Cover And/Or Position Polarity Switch Signal Time/Price Vectors Extending From Key Coordinate Forecast EchoVector Pivot Points: Blue-Purple
For further information on constructing and calculating echovectors, coordinate forecast echovectors, and echovector pivot points, see "The Simple Single-Period EchoVector Pivot Point Calculation".
For further information on constructing and calculating otaps-pps position polarity cover and/or switch signal vectors and their trigger points, see "The On-Off-Through Vector Target Application Price Switch And Position Polarity Cover And/Or Switch Signal Vector Trigger Points".
You can see GoldPivots for further updates that might develop regarding this analysis.
DISCLAIMER
This post is for information purposes only.
There are risks involved with investing including loss of principal. PROTECTVEST AND ADVANCEVEST BY ECHOVECTORVEST MDPP PRECISION PIVOTS makes no explicit or implicit guarantee with respect to performance or the outcome of any investment or projections presented or discussed by PROTECTVEST AND ADVANCEVEST BY ECHOVECTORVEST MDPP PRECISION PIVOTS.
There is no guarantee that the goals of the strategies discussed by PROTECTVEST AND ADVANCEVEST BY ECHOVECTORVEST MDPP PRECISION PIVOTS will be achieved.
NO content published by us on the Site, our Blog, and any Social Media we engage in constitutes a recommendation that any particular investment strategy, security, portfolio of securities, or transaction is suitable for any specific person. Further understand that none of our bloggers, information providers, App providers, or their affiliates are advising you personally concerning the nature, potential, value or suitability of any particular security, portfolio of securities, transaction, investment strategy or other matter.
Again, this post is for information purposes only.
Before making any investment decisions we recommend you first consult with you personal financial adviser.
______________________________________________________________________________
This Week's EchoVector Pivot Point Charts And Analysis Of The Gold Metals Market From Sunday March 2, 2014
CHART UPDATE: Tueaday, March 4, 2014
350PM
 359PM
359PM

This Week's EchoVector Pivot Point Charts And Analysis Of The Gold Metals Market
The bounce from there ran into resistance in late August at $137.50. The price then fell all the way back to just under its first bounce starting price, before starting a second major bounce at the end of the year. Up 18%, then down 18%; a traders' dream, but not a very kind trek for investors. This second major bounce we are now in seems well underway, with the GLD trading this week above the $129 for a gain of over 12% since its start near the end of December.
A good question this week is whether or not to add to long positions into gold's recent strength, particularly on any signs of daily price weakness, or to consider turning cautious on gold again and perhaps to start lightening up, or to even switch orientation, that is, position polarity, altogether and go net short? Will this second major bounce hold up, and will it move gold's price on to higher highs than occurred last August? Or will this latest bounce fizzle as the one before it did? Will it perhaps even fizzle at lower highs, setting the stage for a longer term technical decay, and fizzle even before gold has a chance to close above the $130 level this quarter? How should all this gold market be approached given gold's recent price history
KEY FUNDAMENTAL PROS AND CONS
The news is full of discussions of current fundamentals that support either the long or the short position arguments for positioning in gold.
Pros:
1. China overtakes India as the primary consumer and has consumption at an all time high. Many believe this trend will continue.
2. Political and economic turmoil in other emerging countries may spike addition safe haven interest in gold there.
3. The process of US Federal Reserve Bond Tapering may give ceteris paribus lift to gold buying interest.
4. The US return to forecast economic vitality may lead to commodity price stimulus, and this positively impact gold prices within the general commodities structure.
5. The US dollar's future directional uncertainty may continue to provide some marginal safe haven interest in gold.
Cons:
1. Although gold miners' stocks were crushed last year, and have bounced back this year so far, these gold sector leaders may not be finished with their cyclical washout, a continued directional indicator for the precious metals themselves.
2. Interest in gold futures open interest remains in its 2-year downtrend.
3. Political and economic uncertainty in china's outlook may actually begin to dampen otherwise robust demand for gold there.
4. As gold prices rise, the short term stimulus in quantity demanded at the margin from the prior dramatic price drop may begin to reverse.
RESPONDING FORWARD: A LOOK AT IMPORTANT ACTIVE CYCLES
In December I issued an important price reversal alert calling for a bounce in gold into mid-January, and possibly beyond. I held that such a short-term bounce could and should be positioned into, on a trading basis at the very least. But, more importantly, also positioned into because of the possibility that gold might find longer term presidential cycle echovector support in 2014, and that this support might not necessarily materialize at lower absolute price levels. As mentioned, the price of gold has moved forward very nicely since December.
On January 12TH 2014, when the GLD had moved forward and closed just above the $120 level, I published my article "Revisiting Gold" featuring a close look at the charts. I emphasized how waiting until the end of June had been a very good annual risk-on risk-management strategy for gold since July 2009, and how exacting chart work also indicated early February and late July/early August proved to be significant inflection points in gold's price direction in 2010, and how a close watch in those periods this year might be prudent, keeping in mind the potential for the presidential cycle echovector symmetry to continue.
The late July/early August inflection point also proved active and significant in 2012, within the subsumed congressional cycle occurring within this current presidential cycle, which is also significant. This inflection point continued to prove operant in each of the subsumed annual cycles within this presidential cycle as well, which is further significant.
I highlighted how important, from an echovector analysis perspective, the period going forward into January's primary option expiration was, and how important the three week's following options expiration was, on a cyclical echovector analysis basis.
Last year, as well as the last several quarters, the period following the January quarterly option's expiration cycle did little in forwarding gold metals price levels, and actually proved quite precarious to prices into the first week of the following month, and in some instances, more so even beyond. However, the power of the 4-year presidential cycle echovector and the 2-year congressional cycle echovector could easily trump nearer term quarterly patterns that accrued during the recent down-pressure period.
Because of this risk, I suggested positive caution going forward, and the application of advanced triggered OTAPS switching applications in current open position management. For context see the following chart.
(Click to enlarge)
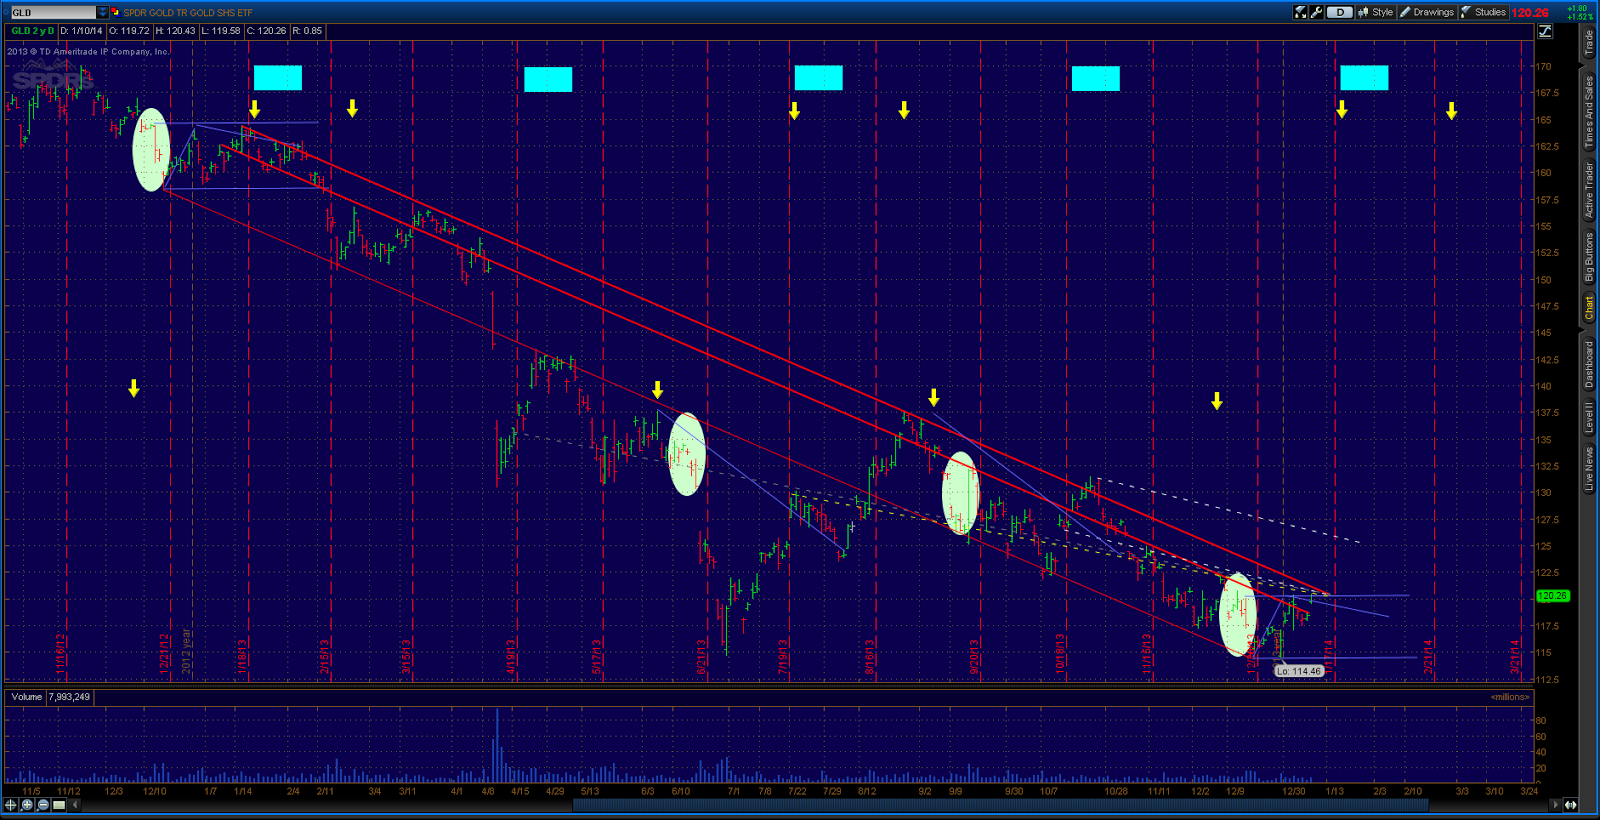
In the chart above the horizontal blue-purple extension vectors running about 2 months worth of trading days long from the light green oval areas in December of 2013 and December of 2012. The lower horizontal price level and time period following December of each year represents the currently active lower threshold OTAPS-PPS price level target switch, and the upper horizontal price level represents the upper threshold OTAPS price level target switch. Price movement up through the upper threshold generates a double-double open long at that trigger price and time. Price movement down through the upper threshold closes any open long positions and generates a double-double open short position at that price and time. Directional tick is very important here. Effective directional position polarity switching can also be accomplished by setting the effective open and/or close trigger prices one cent on either side of the initial base target trigger price threshold.
Additionally, movement down through the lower threshold OTAPS trigger switch closes any long positions that may otherwise be open, and generates a double-double open short position. Price movement up through the lower threshold switch will close any short position that may be open and generate a double-double long position open. The double-double leverage positions can be accomplished by utilizing related and highly liquid gold metals ULTRA ETF's on margin.
The $120.25 GLD proxy price equivalency level and echovector pivot point and otaps-pps upper band switch level was particularly important. On one side of the switch, gains from the $114.55 level were locked in. On the same side of the switch additional gains could be accrued in case of a rally. While having been penetrated upwards, further gains could also be accrued upon re-penetration to the downside in case of market price weakness. As it turned out, the bias in favor of the presidential cycle echovector and the congressional cycle echovector for relative strength right up into the last week of February occurred. And this proved very profitable for adherents to the analysis and to the active position management strategy discussed. See the chart below.
GLD ETF 4-YEAR DAILY OHLC
PRESIDENTIAL CYCLE ECHOVECTOR ANALYSIS PERSPECTIVE
(Click to enlarge charts)
TUESDAY 2/25/14
THURSDAY 2/27/14 950AMEST UPDATE(click to enlarge)

FURTHER ANALYSIS, STRATEGY, AND EFFECTIVLY MANAGING WHAT'S AHEAD
This brings us back to the main question, "Is it now time for caution in gold to the extent of position adjustment; that is, is it time for position cover or even time for position polarity reversal now that momentum price lift into this part of February has been fulfilled? We have collected $15 on the GLD, over 13%, and about four times that on an open double-double position, over 50%, in just 2 months!
Or does the positive price lift from the December lows to current price levels portend further strength ahead this year, and should we think about adding to our position, and not trimming it back?
If it is time again for position adjustment, and if so, then which adjustment?
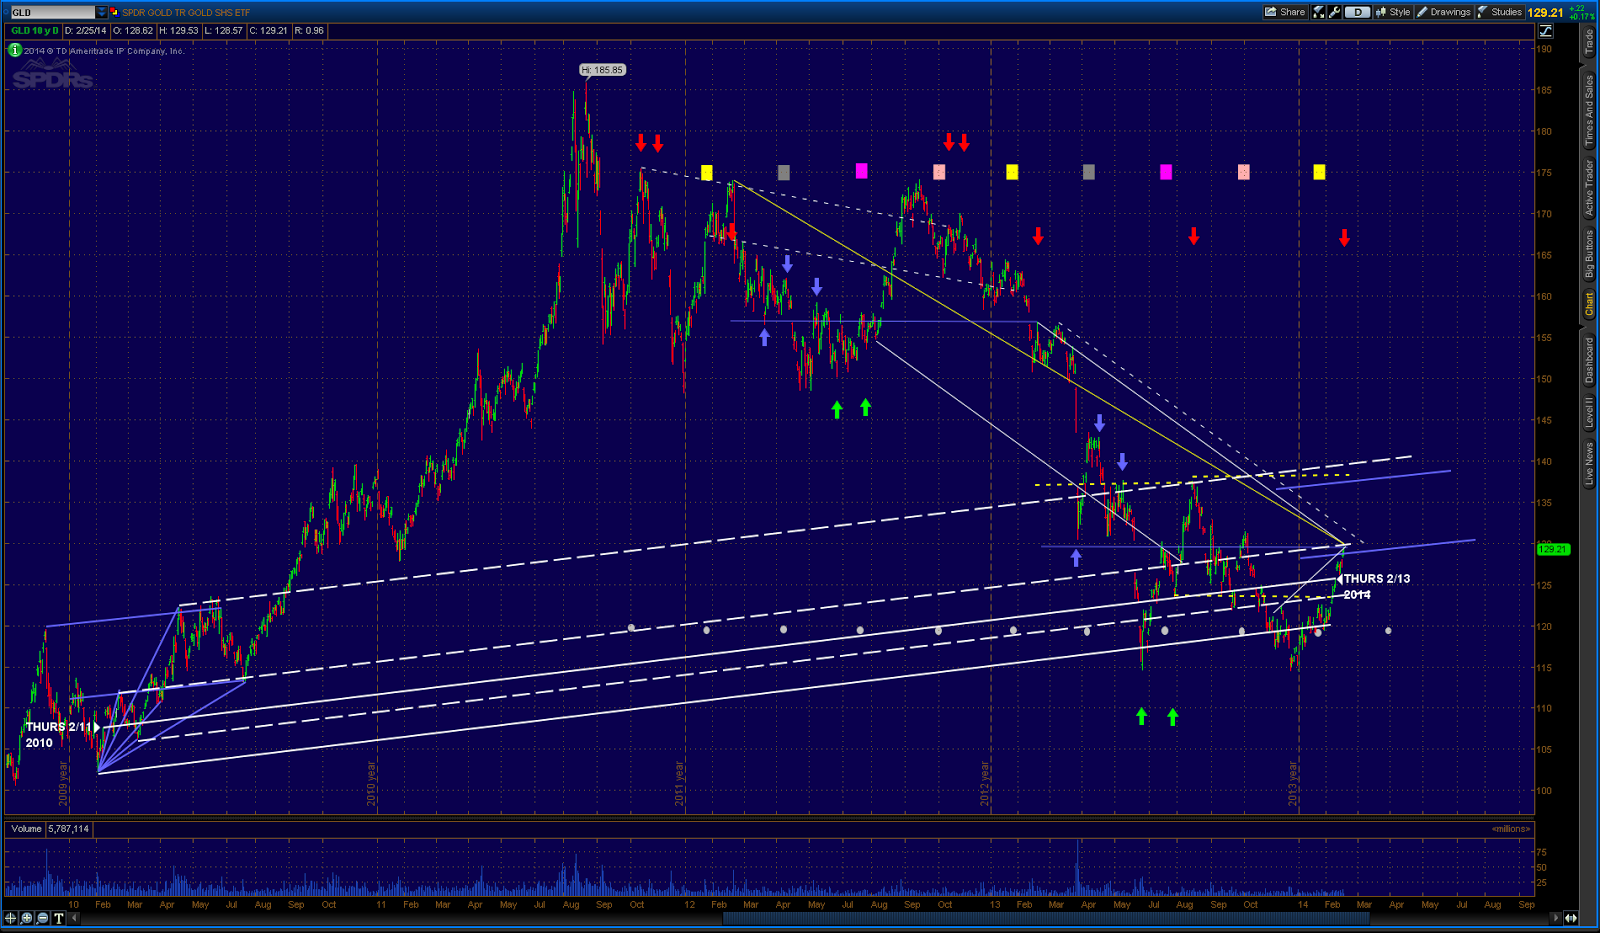
Reviewing the chart above, we see that the bias on the active presidential cycle echovector (white), the congressional cycle echovector (yellow), the annual cycle echovector (shorter white), and the bi-quarterly cycle echovector (shorter yellow) from Tuesday's close leading to each of their respective echobackdates does not appear to support near-term relative strength.
The blue extension otaps-pps position polarity switch signal vectors transposed from the forward pivot point cluster in 2010 to the corresponding echo-forward dates in 2014 provide a formal forward analytical context for symmetrical support and resistance pricing and timing indicators and position polarity switching actions moving forward through the quarter of 2014 into the middle of May, given present presidential cycle echovector momentum.
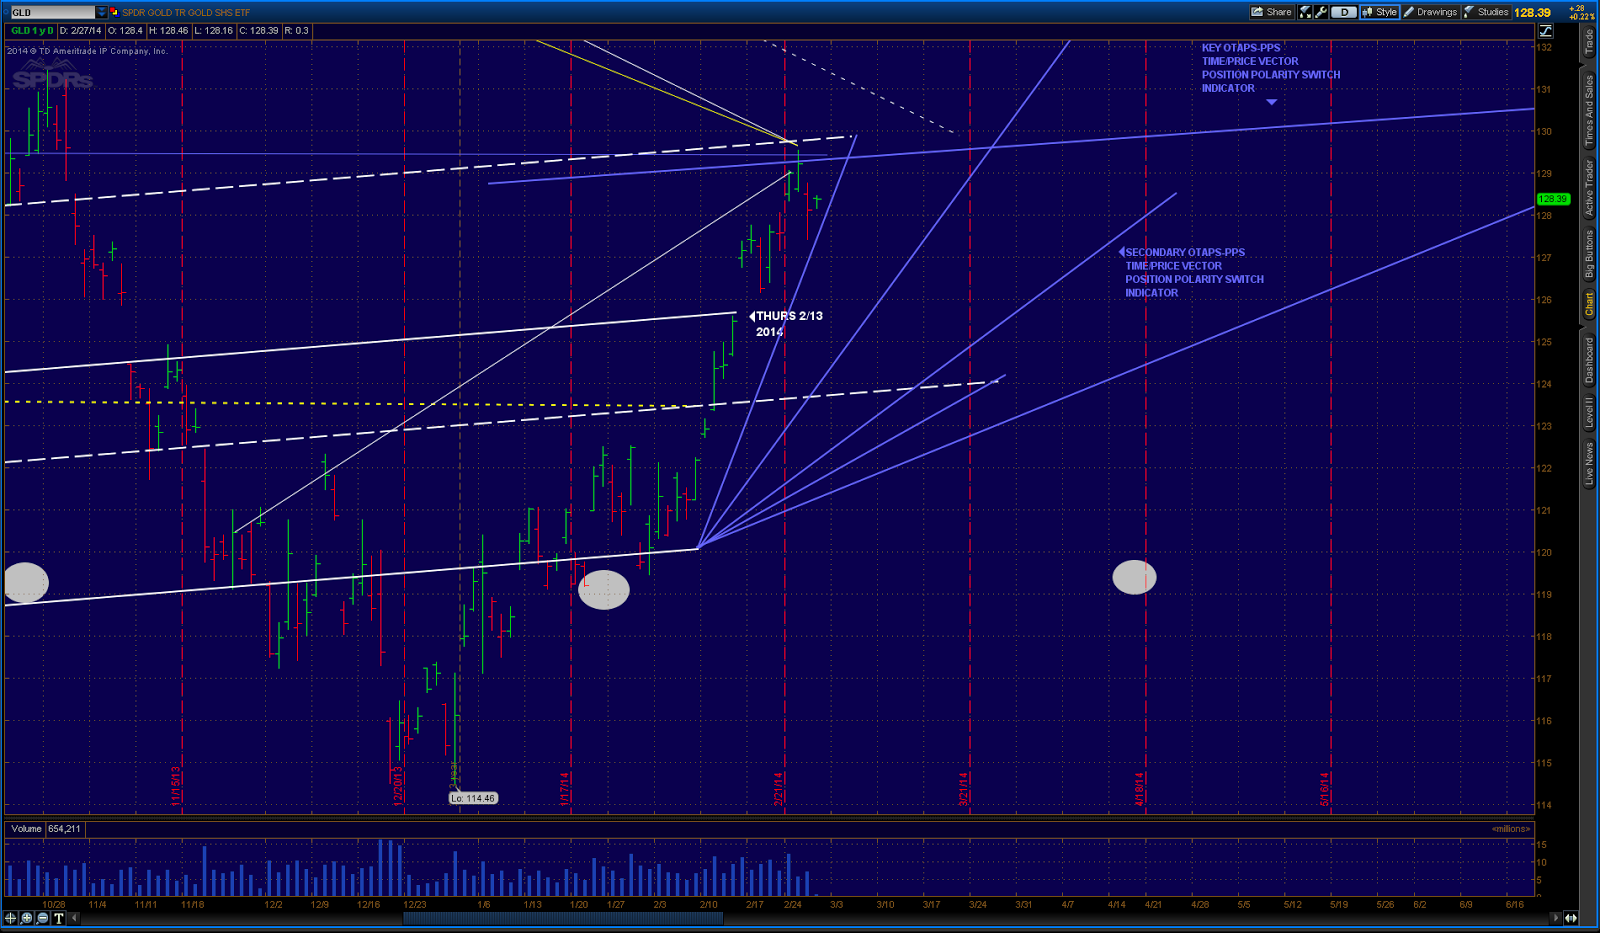
We can identify relative price momentum weakness going into and through many of this March's equivalent periods from the echobackdates of the key echovector cycle lengths we have been examining. For this reason it would be prudent to utilize the key active otaps-pps position cover and position polarity reversal vector highlighted on the chart above to effectively response trigger, and position orient and compliment into, whatever price action the market may bring. This otaps-pps vector currently puts the otaps-pps position cover and/or position reversal price trigger at around the $129.30 level this week. That means a drop through $129.30 on the proxy GLD ETF price equivalency basis for the gold metals market would put net short. Staying above this price, or moving down through it and then back up through it, positions net long gold. Moving down through this price closes long position at it and opens up short below it. See the zoomed chart below.
GLD ETF 4-YEAR DAILY OHLC
PRESIDENTIAL CYCLE ECHOVECTOR ANALYSIS PERSPECTIVE
CHART ABOVE ZOOMED TO FIRST FIVE MONTHS OF 2014
(Click to enlarge charts)
TUESDAY 2/25/14
THURSDAY 2/27/14 950AMEST UPDATE(click to enlarge)
This active advanced position management strategy will enable us to capture and consolidate our well-earned capital gains from late December 2013 while positioning us to take advantage of both further price gains or sudden cyclical price weakness that can occur in the presently volatile gold metals market. Simply remember, when using this active advanced position management strategy it is important to update echovectors and related otaps-pps switch signal vectors generated by them regularly.
Thanks for reading, and godspeed in your gold market investing and trading.
Disclosure: I have no positions in any stocks mentioned, and no plans to initiate any positions within the next 72 hours. I wrote this article myself, and it expresses my own opinions. I am not receiving compensation for it. I have no business relationship with any company whose stock is mentioned in this article.
This article is tagged with: Gold & Precious Metals
ECHOVECTOR CYCLE LENGTH COLOR CODE GUIDE:
4-Year Presidential Cycle EchoVectors: White
2-Year Congressional Cycle EchoVectors: Yellow
1-Year Annual Cycle EchoVectors: White or Red
6-Month Bi-Quarterly Cycle EchoVectors: Yellow
3-Month Quarterly Cycle EchoVectors: White
OTAPS-PPS Position Polarity Cover And/Or Position Polarity Switch Signal Time/Price Vectors Extending From Key Coordinate Forecast EchoVector Pivot Points: Blue-Purple
For further information on constructing and calculating echovectors, coordinate forecast echovectors, and echovector pivot points, see "The Simple Single-Period EchoVector Pivot Point Calculation".
For further information on constructing and calculating otaps-pps position polarity cover and/or switch signal vectors and their trigger points, see "The On-Off-Through Vector Target Application Price Switch And Position Polarity Cover And/Or Switch Signal Vector Trigger Points".
You can see GoldPivots for further updates that might develop regarding this analysis.
Kevin John Bradford Wilbur is the Chief Market Strategist and Senior EchoVector Analysis Methodologist at ADVANCEVEST. He is a prize-winning Economist and Financial Physicist with an over 35 year span of experience and awards in Academics, Research, Management, Practice and Trade. Kevin has specialized experience in the Major Market Indexes, Commodities, ETFs, and in derivatives and the derivatives markets.
DISCLAIMER
This post is for information purposes only.
There are risks involved with investing including loss of principal. PROTECTVEST AND ADVANCEVEST BY ECHOVECTORVEST MDPP PRECISION PIVOTS makes no explicit or implicit guarantee with respect to performance or the outcome of any investment or projections presented or discussed by PROTECTVEST AND ADVANCEVEST BY ECHOVECTORVEST MDPP PRECISION PIVOTS.
There is no guarantee that the goals of the strategies discussed by PROTECTVEST AND ADVANCEVEST BY ECHOVECTORVEST MDPP PRECISION PIVOTS will be achieved.
NO content published by us on the Site, our Blog, and any Social Media we engage in constitutes a recommendation that any particular investment strategy, security, portfolio of securities, or transaction is suitable for any specific person. Further understand that none of our bloggers, information providers, App providers, or their affiliates are advising you personally concerning the nature, potential, value or suitability of any particular security, portfolio of securities, transaction, investment strategy or other matter.
Again, this post is for information purposes only.
Before making any investment decisions we recommend you first consult with you personal financial adviser.
____________________________________________________________________
This Week's EchoVector Pivot Point Charts And
Analysis of the Gold Metals Market
Is it Time to Be Cautious Buying Gold, or Time to Buy More? EchoVector Pivot Point Analysis May Have the Answer!
ARTICLE
Gold's dramatic price decline in the first half of last year has been big news. Since then, gold has found support on a GLD ETF basis at about $115, and is in its second bounce from this price level. The second bounce started in late December. The first bounce started at the end of June at the low of last year's dramatic first half decline.
Gold's dramatic price decline in the first half of last year has been big news. Since then, gold has found support on a GLD ETF basis at about $115, and is in its second bounce from this price level. The second bounce started in late December. The first bounce started at the end of June at the low of last year's dramatic first half decline.
The bounce from there ran into resistance in late August at $137.50. The price then fell all the way back to just under its first bounce starting price, before starting a second major bounce at the end of the year. Up 18%, then down 18%; a traders' dream, but not a very kind trek for investors. This second major bounce we are now in seems well underway, with the GLD trading this week above the $129 for a gain of over 12% since its start near the end of December.
A good question this week is whether to add long position into gold's recent strength, particularly on any signs of daily price weakness, or to consider turning cautious on gold again and perhaps to start lightening up, or to even switch position polarity altogether and go net short? Will this second major bounce hold up, and will it move gold's price on to higher highs than occurred last August? Or will this latest bounce fizzle as the one before it did? Will it perhaps even fizzle at lower highs, setting the stage for a longer term technical decay, and fizzle even before gold has a chance to close above the $130 level this quarter? How should all this gold market be approached given gold's recent price history
LOOKING FORWARD
In December I issued an important price reversal alert calling for a bounce in gold into mid-January, and possibly beyond. I held that such a short-term bounce could and should be positioned into, on a trading basis at the very least. But, more importantly, also positioned into because of the possibility that gold might find longer term presidential cycle echovector support in 2014, and that this support might not necessarily materialize at lower absolute price levels. As mentioned, the price of gold has moved forward very nicely since December.
On January 12TH 2014, when the GLD had moved forward and closed just above the $120 level, I published my article "Revisiting Gold" featuring a close look at the charts. I emphasized how waiting until the end of June had been a very good annual risk-on risk-management strategy for gold since July 2009, and how exacting chart work also indicated early February and late July/early August proved to be significant inflection points in gold's price direction in 2010, and how a close watch in those periods this year might be prudent, keeping in mind the potential for the presidential cycle echovector symmetry to continue.
The late July/early August inflection point also proved active and significant in 2012, within the subsumed congressional cycle occurring within this current presidential cycle, which is also significant. This inflection point continued to prove operant in each of the subsumed annual cycles within this presidential cycle as well, which is further significant.
I highlighted how important, from an echovector analysis perspective, the period going forward into January's primary option expiration was, and how important the three week's following options expiration was, on a cyclical echovector analysis basis.
Last year, as well as the last several quarters, the period following the January quarterly option's expiration cycle did little in forwarding gold metals price levels, and actually proved quite precarious to prices into the first week of the following month, and in some instances, more so even beyond. However, the power of the 4-year presidential cycle echovector and the 2-year congressional cycle echovector could easily trump nearer term quarterly patterns that accrued during the recent down-pressure period.
Because of this risk, I suggested positive caution going forward, and the application of advanced triggered OTAPS switching applications in current open position management. For context see the following first chart attached.
GLD ETF ECHOVECTOR ANALYSIS FRAMECHART
Annual EchoVector Gold Chart: December 2012 Through December 2013 Highlighted

In the chart referenced above the horizontal blue-purple extension vectors running about 2 months worth of trading days long from the light green oval areas in December of 2013 and December of 2012. The lower horizontal price level and time period following December of each year represents the currently active lower threshold OTAPS-PPS price level target switch, and the upper horizontal price level represents the upper threshold OTAPS price level target switch. Price movement up through the upper threshold generates a double-double open long at that trigger price and time. Price movement down through the upper threshold closes any open long positions and generates a double-double open short position at that price and time. Directional tick is very important here. Effective directional position polarity switching can also be accomplished by setting the effective open and/or close trigger prices one cent on either side of the initial base target trigger price threshold.
Additionally, movement down through the lower threshold OTAPS trigger switch closes any long positions that may otherwise be open, and generates a double-double open short position. Price movement up through the lower threshold switch will close any short position that may be open and generate a double-double long position open. The double-double leverage positions can be accomplished by utilizing related and highly liquid gold metals ULTRA ETF's on margin.
The $120.25 GLD proxy price equivalency level and echovector pivot point and otaps-pps upper band switch level was particularly important. On one side of the switch, gains from the $114.55 level were locked in. On the same side of the switch additional gains could be accrued in case of a rally. While having been penetrated upwards, further gains could also be accrued upon re-penetration to the downside in case of market price weakness. As it turned out, the bias in favor of the presidential cycle echovector and the congressional cycle echovector for relative strength right up into the last week of February occurred. And this proved very profitable for adherents to the analysis and to the active position management strategy discussed. See the second chart attached.
FURTHER ANALYSIS, STRATEGY, AND MANAGING WHAT'S AHEAD
This brings us back to the main question, "Is it now time for caution in gold to the extent of position adjustment; that is, is it time for position cover or even time for position polarity reversal now that momentum price lift into this part of February has been fulfilled? We have collected $15 on the GLD, over 13%, and about four times that on an open double-double position, over 50%, in just 2 months!
Or does the positive price lift from the December lows to current price levels portend further strength ahead this year, and should we think about adding to our position, and not trimming it back?
If it is time again for position adjustment, and if so, then which adjustment?
GLD ETF ECHOVECTOR ANALYSIS FRAMECHART
Presidential Cycle EchoVector Pivot Point Analysis And Projection Illustration Chart:

Reviewing the chart above, we see that the bias on the active presidential cycle echovector (white), the congressional cycle echovector (yellow), the annual cycle echovector (shorter white), and the bi-quarterly cycle echovector (shorter yellow) from Tuesday's close leading to each of their respective echobackdates does not appear to support near-term relative strength.
The blue extension otaps-pps position polarity switch signal vectors transposed from the forward pivot point cluster in 2010 to the corresponding echo-forward dates in 2014 provide a formal forward analytical context for symmetrical support and resistance pricing and timing indicators and position polarity switching actions moving forward through the quarter of 2014 into the middle of May, given present presidential cycle echovector momentum.
We can identify relative price momentum weakness going into and through many of this March's equivalent periods from the echobackdates of the key echovector cycle lengths we have been examining. For this reason it would be prudent to utilize the key active otaps-pps position cover and position polarity reversal vector highlighted on the chart above to effectively response trigger, and position orient and compliment into, whatever price action the market may bring. This otaps-pps vector currently puts the otaps-pps position cover and/or position reversal price trigger at around the $129.30 level this week. That means a drop through $129.30 on the proxy GLD ETF price equivalency basis for the gold metals market would put net short. Staying above this price, or moving down through it and then back up through it, positions net long gold. Moving down through this price closes long position at it and opens up short below it. See the third zoomed chart attached.
GLD ETF ECHOVECTOR ANALYSIS FRAMECHART
Presidential Cycle EchoVector Pivot Point Analysis And Projection Illustration Chart - Zoomed

This active advanced position management strategy will enable us to capture and consolidate our well-earned capital gains from late December 2013 while positioning us to take advantage of both further price gains or sudden cyclical price weakness that can occur in the presently volatile gold metals market. Simply remember, when using this active advanced position management strategy it is important to update echovectors and related otaps-pps switch signal vectors generated by them regularly.
For further information on constructing and calculating echovectors, coordinate forecast echovectors, and echovector pivot points, see "The Simple Single-Period EchoVector Pivot Point Calculation".
For further information on constructing and calculating otaps-pps position polarity cover and/or switch signal vectors and their trigger points, see "The On-Off-Through Vector Target Application Price Switch And Position Polarity Cover And/Or Switch Signal Vector Trigger Points".
For further information on constructing and calculating otaps-pps position polarity cover and/or switch signal vectors and their trigger points, see "The On-Off-Through Vector Target Application Price Switch And Position Polarity Cover And/Or Switch Signal Vector Trigger Points".
You can see GoldPivots for further updates that might develop regarding this analysis.
Thanks for reading, and godspeed in your gold market investing and trading.
Thanks for reading, and godspeed in your gold market investing and trading.
Disclosure: I have no positions in any stocks mentioned, and no plans to initiate any positions within the next 72 hours. I wrote this article myself, and it expresses my own opinions. I am not receiving compensation for it. I have no business relationship with any company whose stock is mentioned in this article.
ECHOVECTOR CYCLE LENGTH COLOR CODE GUIDE
FOR ECHOVECTOR ANALYSIS FRAMECHARTS
4-Year Presidential Cycle EchoVectors: White
2-Year Congressional Cycle EchoVectors: Yellow
1-Year Annual Cycle EchoVectors: White or Red
6-Month Bi-Quarterly Cycle EchoVectors: Yellow
3-Month Quarterly Cycle EchoVectors: White
OTAPS-PPS Position Polarity Cover And/Or Position Polarity Switch Signal Time/Price Vectors Extending From Key Coordinate Forecast EchoVector Pivot Points: Blue-Purple
Kevin John Bradford Wilbur is the Chief Market Strategist and Senior EchoVector Analysis Methodologist at PROTECTVEST AND ADVANCEVEST. He is a prize-winning Economist and Financial Physicist with an over 35 year span of experience and awards in Academics, Research, Management, Practice and Trade. Kevin has specialized experience in the Major Market Indexes, Commodities, ETFs, and in derivatives and the derivatives markets.
DISCLAIMER
This post is for information purposes only.
There are risks involved with investing including loss of principal. PROTECTVEST AND ADVANCEVEST BY ECHOVECTORVEST MDPP PRECISION PIVOTS makes no explicit or implicit guarantee with respect to performance or the outcome of any investment or projections presented or discussed by PROTECTVEST AND ADVANCEVEST BY ECHOVECTORVEST MDPP PRECISION PIVOTS.
There is no guarantee that the goals of the strategies discussed by PROTECTVEST AND ADVANCEVEST BY ECHOVECTORVEST MDPP PRECISION PIVOTS will be achieved.
NO content published by us on the Site, our Blog, and any Social Media we engage in constitutes a recommendation that any particular investment strategy, security, portfolio of securities, or transaction is suitable for any specific person. Further understand that none of our bloggers, information providers, App providers, or their affiliates are advising you personally concerning the nature, potential, value or suitability of any particular security, portfolio of securities, transaction, investment strategy or other matter.
Again, this post is for information purposes only.
Before making any investment decisions we recommend you first consult with you personal financial adviser.
____________________________________________________________________________
A Time For Caution In Gold, Or Time To Buy More?
A Time For Caution In Gold, Or Time To Buy More?
This Week's EchoVector Pivot Point Charts and Analysis And Active Advanced Position Management OTAPS-PPS Approach For The Gold Metals Market: 2/25/14
ARTICLE
BACKGROUND: LAST YEAR IN REVIEW
BACKGROUND: LAST YEAR IN REVIEW
Last year the dramatic decline in gold prices that occurred since the fall of 2012 was big news. Fortunately, in November of 2012 I alerted the gold market to what then was a cyclically important week in gold. The two weeks of trading that followed proved to be of great interest to participants worldwide. The price of gold fell significantly, trading down from around $160 on the GLD ETF to a low just below $151, a fall of over 5.5%.
I reiterated the importance of this same cyclical week a quarter later in my article of February 11, 2013, titled "Gold Chart: Cyclically An Important Week In Gold". That cyclical week proved important again indeed. So much so that, in late February of 2013 (this week a year ago), amidst a plethora of bullishly speculative articles, and when gold was bouncing off a seeming near-term bottom, and when many analyst where again filled with risk-on enthusiasm for the precious metal, I instead suggested that regardless of the relative price level of gold at that time, a more prudent strategy likely was to enter gold closer to the end of June 2013 for a seasonal bounce. See "Gold Chart: Price May Be Right, But Is Timing?"
Well, I couldn't have been more correct. Gold incurred a massive leg down in April of 2013.
Encountering again significant gold risk-on enthusiasm at these new lower price levels. In May of 2013 I elected to put out a third article on gold titled, "Gold Charts: Warning In February Still Valid Today". In that article I warned that last year's then seasonal down-pressure was still likely not over. The wisdom of February's article had become fully apparent, with gold prices down another 20%, and the GLD falling near $131. In May's article I reiterated the importance of waiting patiently for the end of June to find a positive risk-reward re-entry time-point for gold, based on advanced echovector analysis. Another final leg down was forecast in May. As things ended up, it would have been hard for me, and for the echovector analysis approach to have been more correct, with gold falling further in June 2013 to a closing low on the GLD the week of June 27TH below $116. Meeting both my price and timing targets then, I issued a major buy signal alert consistent with these article's analysis and forecasts.
As forecast and warned early last year, the first half of 2013 proved to be an historic sell-off in gold prices. My model had indicated the strong seasonal buy signal at the end of June 2013 early on. And the bottom did come in on June 27TH, the week it was forecast due, and given with clear notice of a possible bounce back to the $135 area into September, but also with clear notice and with a warning again going forward from there into the end of the year, This was all also all published at the respective "Market Alpha Newsletter Group" newsletters and websites,goldinvestorweekly.com and goldpivots.com, and at my EchoVector Analysis webpage at seekingalpha.com
The 2013 gold metals EchoVector Analysis forecast unfolded right on target. In August I reiterated notice of the possible bounce back to the $135 area into September, and also reiterated warnings that the risk-reward ratio to any such risk-on positions would begin to increase dramatically the week of September's primary options on an annual echovector perspective basis. I also presented analysis to this effect. This can be found in the August 2013 articles "As In Previous Quarters, This Is A Very Important Week In The Gold Market" and "Today Is An Important Day For Gold", as well as in additional posts published atseekingalpha.com and goldinvestorweekly.com and goldpivots.com in August that year.
On September 5TH of 2013, believing the better part of the season bounce was coming mature, I also published my article "Watch Out On Gold" alerting investors and trader's to specifics on how to interpret ensuing gold price motion mechanics, and when to exit the seasonal bounce using these, and when to reverse their short term longs back to shorts, and showed how nothing had changed regarding gold moving out of its "strong downward annual echovector momentum" that had been active into its low in the summer, and showed that these lows could easily be revisited before the year's end once again on an EchoVector Analysis basis.
On December 19TH 2013 I issued my final reversal Alert for 2013, calling for a bounce in gold into mid-January, and then possibly beyond. I believed such a short-term bounce could and should be positioned into on a trading basis at the very least. But also positioned into because of the possibility that gold might find longer term Presidential Cycle EchoVector support in 2014, and that this support might not necessarily materialize at lower absolute price levels. As it turned out, I was correct, and gold metal prices have moved forward very nicely since the Alert at the $115 level in December on the GLD ETF gold metals proxy price equivalency basis.
FORECAST: FORWARD INTO THIS YEAR
On January 12TH 2014, when the GLD had moved forward and closed just above the $120 level, I published my article "Revisiting Gold...", featuring a then current look at the charts.
In the article I emphasized how following EchoVector Analysis chart updates from both February and August 2013 on the GLD ETF, which illustrated how waiting until the end of June, had been a very good annual risk-on risk-management strategy for gold since July 2009.
The charts also indicated promise regarding a possible presidential cycle echo year in 2014 to its echobackyear of 2010 four years earlier, and how early February and late July/early August both proved to be significant inflection points in gold's price direction in 2010, and how a close watch in those periods in 2014 would be prudent as well.
The late July/early August inflection point had also proved to be once again active and significant in 2012, within the subsumed and in phase congressional cycle within this presidential cycle, which is also significant. It has also continued to prove operant in each of the subsumed annual cycles within this presidential cycle as well, which is further significant.
I also mentioned how those individuals who have been following the EchoVector Analysis Model alerts, and positioning in a manner consistent with its double-double leverage approach -- which utilizes related ETF Ultras and margin for extra leverage and multiples -- are very likely extremely happy with the 2013 EchoVector Analysis forecasts and advanced position management outcomes. I also mentioned at that time that such investors and traders were double-double long gold at the GLD ETF $114.55 proxy price equivalency basis, and had been so since the week before Christmas 2013, based on the major EchoVector Analysis OTAPS-PPS strategy and position management alert issued in late December 2013. And they might even had been more aggressively (and even more profitably) long having used even more advanced derivatives management position strategies.
I also highlighted how important a time it was from an EchoVector Analysis Perspective for gold metals prices going forward into January's primary option expiration, and how important it was going forward into the following three week's from there also.
Last year, as well as the last several quarters, the period following the January quarterly option's expiration cycle did little in forwarding gold metals price levels, and actually proved quite precarious to prices into the first week of the following month, and in some instances, more so even beyond. However, the power of the 4-year presidential cycle echovector and the 2-year congressional cycle echovector could easily trump nearer term quarterly patterns that accrued during the recent down-pressure period.
Because of this risk, I suggested positive caution going forward, and the application of advanced triggered OTAPS switching applications in current open position management. For context see the following chart. Corresponding analysis, strategy, and position management protocols were also discussed.
(click to enlarge)
In the chart above the horizontal blue-purple extension vectors running about 2 months worth of trading days long from the light green oval areas in December of 2013 and December of 2012. The lower horizontal price level and time period following December of each year represents the currently active lower threshold OTAPS-PPS price level target switch, and the upper horizontal price level represents the upper threshold OTAPS price level target switch. Price movement up through the upper threshold generates a double-double open long at that trigger price and time. Price Movement down through the upper threshold closes any open long positions and generates a double-double open short position at that price and time. Directional tick is very important here. Effective directional position polarity switching can also be accomplished by setting the effective open and/or close trigger prices one cent on either side of the initial base target trigger price threshold.
Additionally, movement down through the lower threshold OTAPS trigger switch closes any long positions that may otherwise be open, and generates a double-double open short position. Price movement up through the lower threshold switch will close any short position that may be open and generate a double-double long position open. The double-double leverage positions can be accomplished by utilizing related and highly liquid gold metals ULTRA ETF's on margin.
The $120.25 GLD proxy price equivalency level and echovector pivot point and otaps-pps upper band switch level was particularly important. On one side of the switch, gains from the $114.55 level were locked in. On the same side of the switch additional gains could be accrued in case of a rally. While having been penetrated upwards, further gains could also be accrued upon re-penetration to the downside in case of market price weakness. As it turned out, the bias in favor of the presidential cycle echovector and the congressional cycle echoVector for relative strength right up into the last week of February occurred. And this proved very profitable for adherents to the analysis and to the active position management strategy discussed. See the chart below.
GLD ETF 4-YEAR DAILY OHLC
PRESIDENTIAL CYCLE ECHOVECTOR ANALYSIS PERSPECTIVE
(click to enlarge)
ECHOVECTOR ANALYSIS FRAMECHARTS, STRATEGY, AND THE WEEK AHEAD
This brings us to the following question, "Is it time for caution; that is, is it time for position cover or even time for position polarity reversal now that momentum lift into this part of February has been fulfilled? We have collected $15 on the GLD, over 13%, and about four times that on an open double-double position, over 50% in about 2 months!
Does the positive price lift from the December lows to current price levels portend further strength ahead this year, and should we think about adding to our position, and not trimming back?
Reviewing the chart above, we see that the bias on the active presidential cycle echovector (white), the congressional cycle echovector (yellow), the annual cycle echovector (shorter white), and the bi-quarterly cycle echovector (shorter yellow) from Tuesday's close leading to each of their respective echobackdates does not appear to support near-term relative strength.
The blue extension otaps-pps position polarity switch signal vectors transposed from the forward pivot point cluster in 2010 to the corresponding echo-forward dates in 2014 provide a formal forward analytical context for symmetrical support and resistance pricing and timing indicators and position polarity switching actions moving forward through the quarter of 2014 into the middle of May, given present presidential cycle echovector momentum. We can identify relative price momentum weakness going into and through many of this March's equivalent periods from the echobackdates of the key echovector cycle lengths we have been examining. For this reason it would be prudent to utilize the key active otaps-pps position cover and position polarity reversal vector highlighted on the chart above. This puts the otaps-pps position cover and/or position reversal price trigger this week at around the $129.30 GLD ETF proxy price equivalency basis level for the gold metals market. Staying above this price, or moving down through it and then back up through it, positions net long gold. Moving down through this price closes long position at it and opens up short below it. See the zoomed chart below.
GLD ETF 4-YEAR DAILY OHLC
PRESIDENTIAL CYCLE ECHOVECTOR ANALYSIS PERSPECTIVE
CHART ABOVE ZOOMED TO FIRST FIVE MONTHS OF 2014
(click to enlarge)

This active advanced position management strategy will enable us to capture and consolidate our well-earned capital gains from late December 2013 while positioning us to take advantage of both further price gains or sudden cyclical price weakness in the gold metals market. When using this strategy it is important to remember to update and regularly adjust the key active echovectors the otaps-pps active advanced management position adjustment switch signal trigger symmetry transposition is based on. EchoVectors and OTAPS-PPS Position Polarity Cover And Switch Signal Vectors are powerful and advanced and very effective, but also very fluid calculations. It is important to keep up with them.
For information on calculating echovectors, coordinate forecast echovectors, and echovector pivot points yourself, see "The Simple Single-Period EchoVector Pivot Point Calculation."
Thanks for reading, and godspeed in your gold market investing and trading.
METHODOLOGY FOOTNOTES
"EchoVector Theory and EchoVector Analysis assert that a securities prior price patterns may influence its present and future price patterns. Present and future price patterns may then, in part, be considered as 'echoing' these prior price patterns to some identifiable and measurable degree.
EchoVector Analysis is also used to forecast and project potential price Pivot Points (referred to as PPP's --potential pivot points, or EVPP's --EchoVector Pivot Points) and active, past and future coordinate forecast echovector support and resistance echovectors (SREV's) for a security from a starting reference price at a starting reference time, based on the securities prior price pattern within a given and significant and definable cyclical time frame.
EchoVector Pivot Points and EchoVector Support and Resistance Vectors are fundamental components of EchoVector Analysis. EchoVector SREV's are constructed from key components in the EchoVector Pivot Point Calculation. EchoVector SREV's are defined and calculated and also referred to as Coordinate Forecast EchoVectors (CFEV's) to the initial EchoVector (XEV) calculation and construction, where X designates not only the time length of the EchoVector XEV, but also the time length of XEV's CFEVs. The EchoVector Pivot Points are found as the endpoints of XEV's CFEVs' calculations and the CFEVs' constructions.
The EchoVector Pivot Point Calculation is a fundamentally different and more advanced calculation than the traditional pivot point calculation.
The EchoVector Pivot Point Calculation differs from traditional pivot point calculation by reflecting this given and specified cyclical price pattern length and reference, and its significance and information, within the pivot point calculation. This cyclical price pattern and reference is included in the calculations and constructions of the echovector and its respective coordinate forecast echovectors, as well as in the calculation of the related echovector pivot points.
While a traditional pivot point calculation may use simple price averages of prior price highs, lows and closes indifferent to their sequence in time to calculate its set of support and resistance levels, the echovector pivot point calculation begins with any starting time and price point and respective cyclical time frame reference X, and then identifies the corresponding "Echo-Back-Time-Point" within this cyclical time frame reference coordinate to the starting reference price and time point A. It then calculates the echovector (XEV) generated by the starting reference time/price point and the echo-back-time-point, and includes the pre-determined and pre-defined accompanying constellation of "Coordinate Forecast EchoVector" origins derived from the prior price pattern evidenced around the echo-back-time-point within a certain pre-selected and specified range (time and/or price version) that occurred within the particular referenced cyclical time-frame and period X. Security I's EchoVector Pivot Point constructions then calculate and project the scope relative echovector pivot points that follow A, and the support and resistance levels determined by the ensuing coordinate forecast echovectors and their selected range definition inclusion (fully differentiating the time-sequence of the origins), the cyclical time-frame X, and to XEV's slope.
EchoVector Pivot Points are therefore advanced and fluid calculations and effective endpoints of projected coordinate forecast echovector support and resistance time/price levels, projections that are constructed from and follow in time from the starting reference price, time/price point A (echovector endpoint) of the initial subject focus echovector construction, and which occur within an EchoVector Pivot Point Price Projection Parallelogram construct: levels which are derived from coordinate (support and/or resistance) forecast echovectors calculated from particular 'scope and range defined' starting times and price points reflecting the time and price points of proximate scale and scope and time/price pivoting action that followed the initial subject focus interest echovector's echo-back-date-time-price-point B (derived from and relative to the initial subject focus echovector's starting time-point and price-point A, and the echovector's given and specified cyclically-based focus interest time-span X, and the initial subject focus echovector's subsequently derived slope relative momentum measures).
The EchoVector Support and Resistance Vectors, referred to as the Coordinate Forecast Echovectors, are used to generate the EchoVector Pivot Points."
From "Introduction to EchoVector Analysis And EchoVector Pivot Points"COPYRIGHT 2013 ECHOVECTORVEST MDPP PRECISION PIVOTS
Disclosure: I have no positions in any stocks mentioned, but may initiate a short position in GLD over the next 72 hours.
I wrote this article myself, and it expresses my own opinions. I am not receiving compensation for it. I have no business relationship with any company whose stock is mentioned in this article.
Themes: Stock Market Education, Futures, Federal Reserve, Market Currents, ETFs, Macro View, Alerts, Market Outlook, Economy, ETF Long and Short Ideas, ETF Analysis, Long Ideas, Commodities,EchoVectorVEST, Technical Analysis, MDPP Precision Pivots ForecastStocks: GLD, GTU, AGOL, DUST, FSG, GDX, GDXJ, GGGG, GLDX, GLL,IAU, NUGT, SGOL, TBAR, UGL, RING, DBB, DBP, GLTR, PSAU, XME, AGQ,DBS, SIL, SLVP, SIVR, SLV, USLV, DSLV, ZSL, WITE, DGP, DGZ, DZZ,SPGH, UBG, UBM, USV, UGLD, DGLD

No comments:
Post a Comment
Note: Only a member of this blog may post a comment.